
The Next Wave of Oil and Gas Analytics - Reservoir Behavior
Download HEAVY.AI Free, a full-featured version available for use at no cost.
GET FREE LICENSE
Thank you to Jeff Chambers for writing this guest post. He is from UpstreamDB, an OmniSci partner, providing the oil and gas industry dataset and expertise used in our demos.
The Data is Multiplying
For the oil and gas industry, the move to analytics has been fueled by the rise of horizontal drilling. This creates thousands of new test cases each year with many unique variables across multiple disciplines. Once these wells are drilled, monitoring production and reservoir behavior through time leads to an exponential amount of more and more important data. Tracking this reservoir behavior is necessary for all segments of the industry, including E&P companies, midstream companies, mineral buyers, and financial analysts.
Processing… Processing… Bueller… Bueller
Traditional oil and gas analytical datasets are usually comprised of attributes aggregated to a wellbore. This is one row per wellbore with attributes such as production and proppant aggregated in some way to a single attribute. There is a need to keep the dataset smaller with traditional analytics tools or risk constantly staring at a processing bar while moving through geographic regions or data filters.
With OmniSci’s GPU and CPU accelerated analytics, you can visualize and analyze hundreds of millions of rows of data at a time. Some use cases have even analyzed several billion row datasets! This provides users with the ability to perform real-time analytics on datasets they didn’t think was possible before. The dataset we’re using in this study contains over 258 million rows of data. Good luck using traditional BI tools with a dataset this large.
Why Should You Care?
Understanding how attributes such as proppant and horizontal length affect initial production are important, but they were a lot cooler in 2014 and these studies are now becoming dated. The real question on Wall Street has shifted to what’s the true net present value of these expensive horizontal wells, which relates directly to how the reservoirs behave through time.
Understanding decline characteristics, parent-child relationships, and changes in gas-to-oil ratios will ultimately determine which E&P companies succeed and which ones file Chapter 11.
Being able to answer these key questions is crucial, for example:
- How can we best optimize and predict the estimated ultimate recovery (EUR), of a well?
- Can publicly traded E&P companies match the EUR’s that they’ve been stating on the investor relation presentations for years?
- Are all the drillable locations really there?
Understanding and maximizing the reservoir potential through time is one of the next big waves in big data analytics with both public and proprietary data.
Reservoir Analytics Dataset
Through a partnership with UpstreamDB, we have a built-in dataset that contains not only the historical monthly production data, but also other key attributes used in more traditional energy analytics such as horizontal length, depth, and producing formation. We’ve also added key variables for reservoir behavior such as GOR’s. We’ve even included historical oil and gas prices by month to get a feel for the value of energy produced each month. This dataset contains over 258 million rows of data.
Gas-to-Oil-Ratio (GOR) Changes
Here’s a cool example of what can be done with the right dataset and the right software. Gas-to-Oil Ratios (GOR’s for short) have become really important in the industry. Some wells may start out with a low GOR and then transition to a higher GOR as reservoir pressure decreases. The transition to a higher GOR can hamper the economics of an area since natural gas brings in a much lower sales price relative to crude oil.
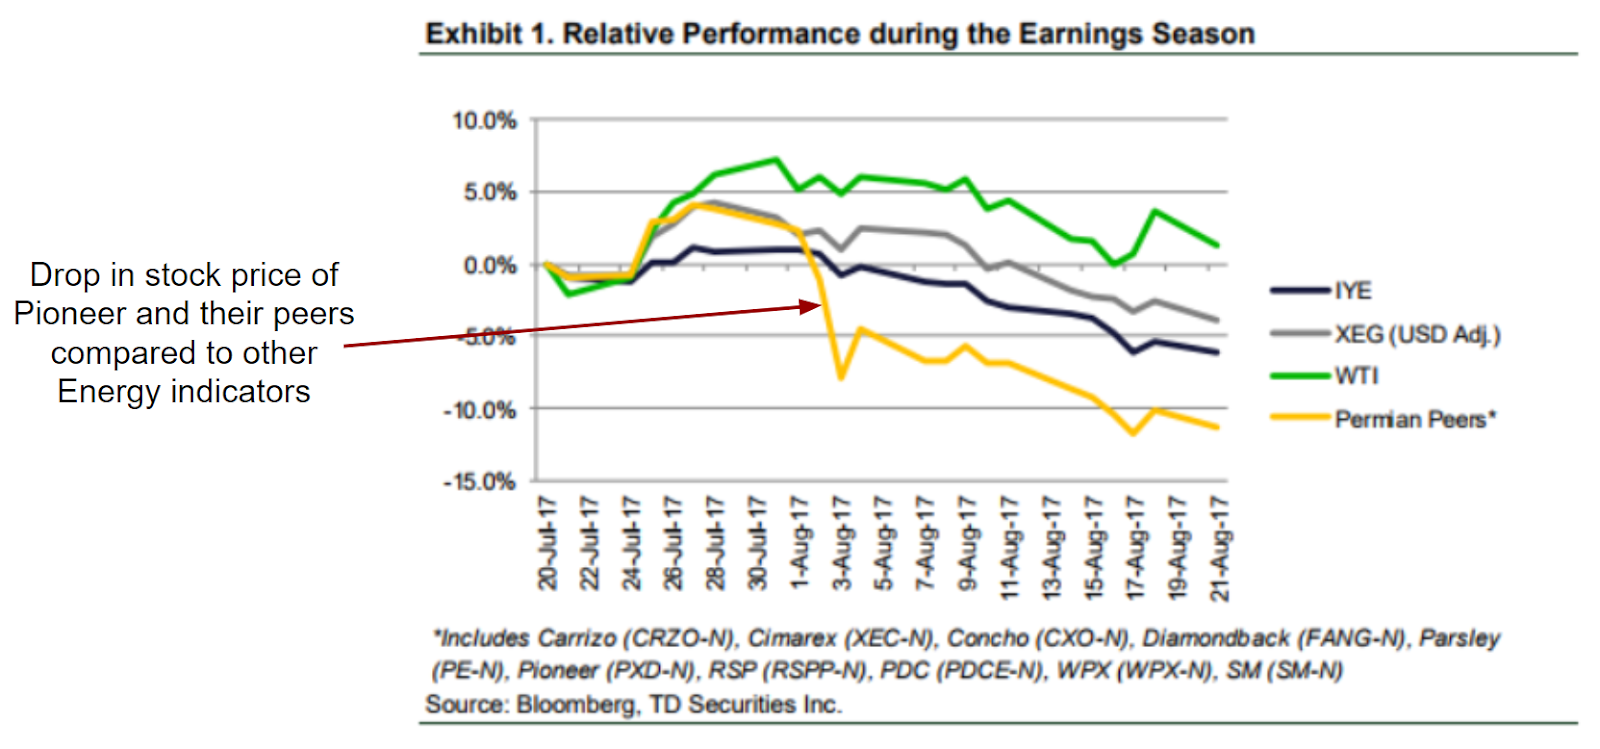
Look at what happened to publicly traded Permian operators in early August of 2017. When Pioneer reported a decrease in production guidance due to higher than anticipated GOR’s, their stock price took a big hit on Wall Street. Since higher GOR’s are related to area reservoir behavior, Pioneer’s peer group in the Permian took a big nose-dive along with them. Reference the graph below showing the Permian peer group versus other energy indicators during this time.
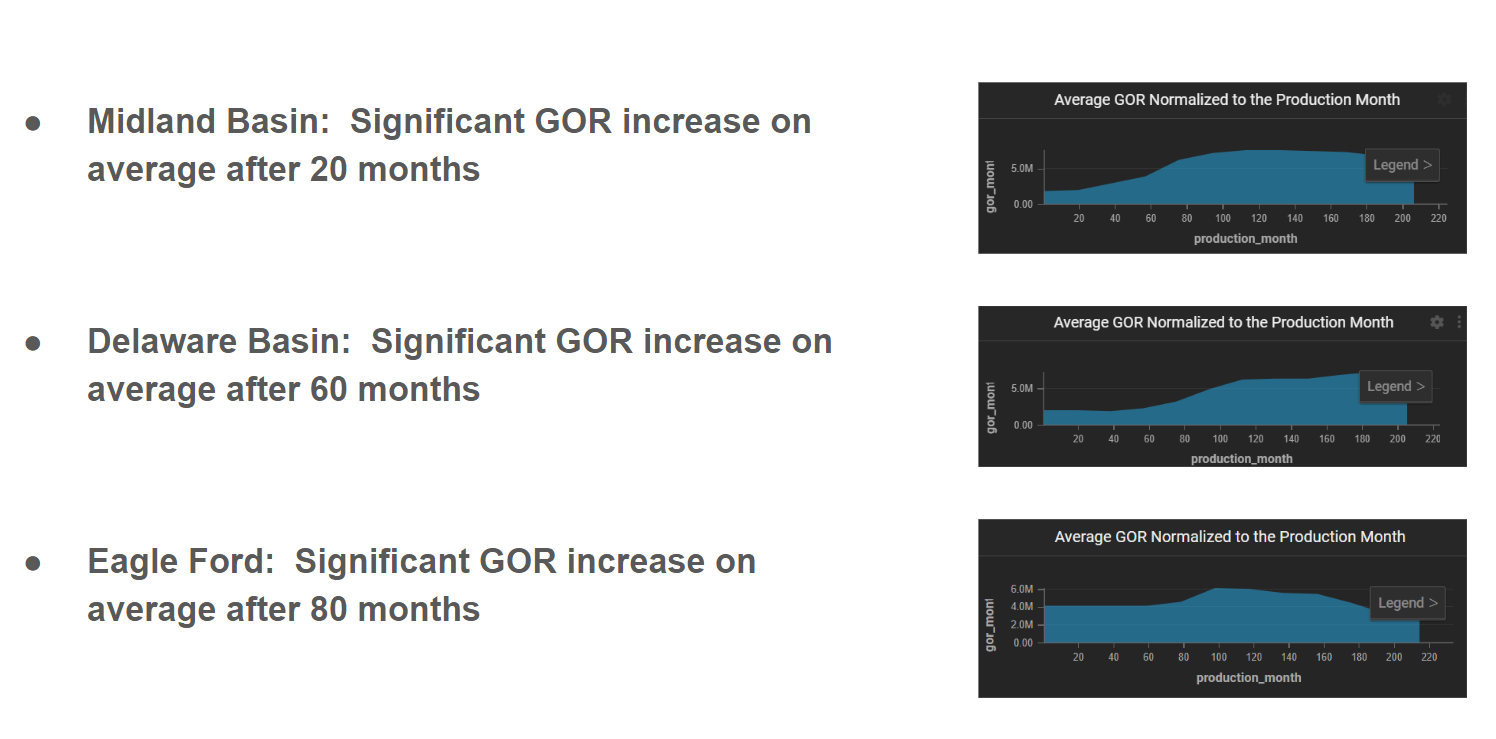
Now let’s use OmniSci and UpstreamDB to track GOR behavior through time by basin. For this we’ve created a custom GOR analysis dashboard. The focus here is on the Midland Basin. All wells are set to time zero so that we time normalize the change in behavior for each well. As we scroll through periods of 25 months at a time, we start to see the Midland Basin becoming more gassy than other major basins such as the Eagle Ford and Delaware Basin. We also see the average GOR start to approach the national average by the average 80th month of production in a well.
The graph below shows the average shifts in GOR for the Midland Basin, the Delaware Basin, and the Eagle Ford.
Where’s the Pay?
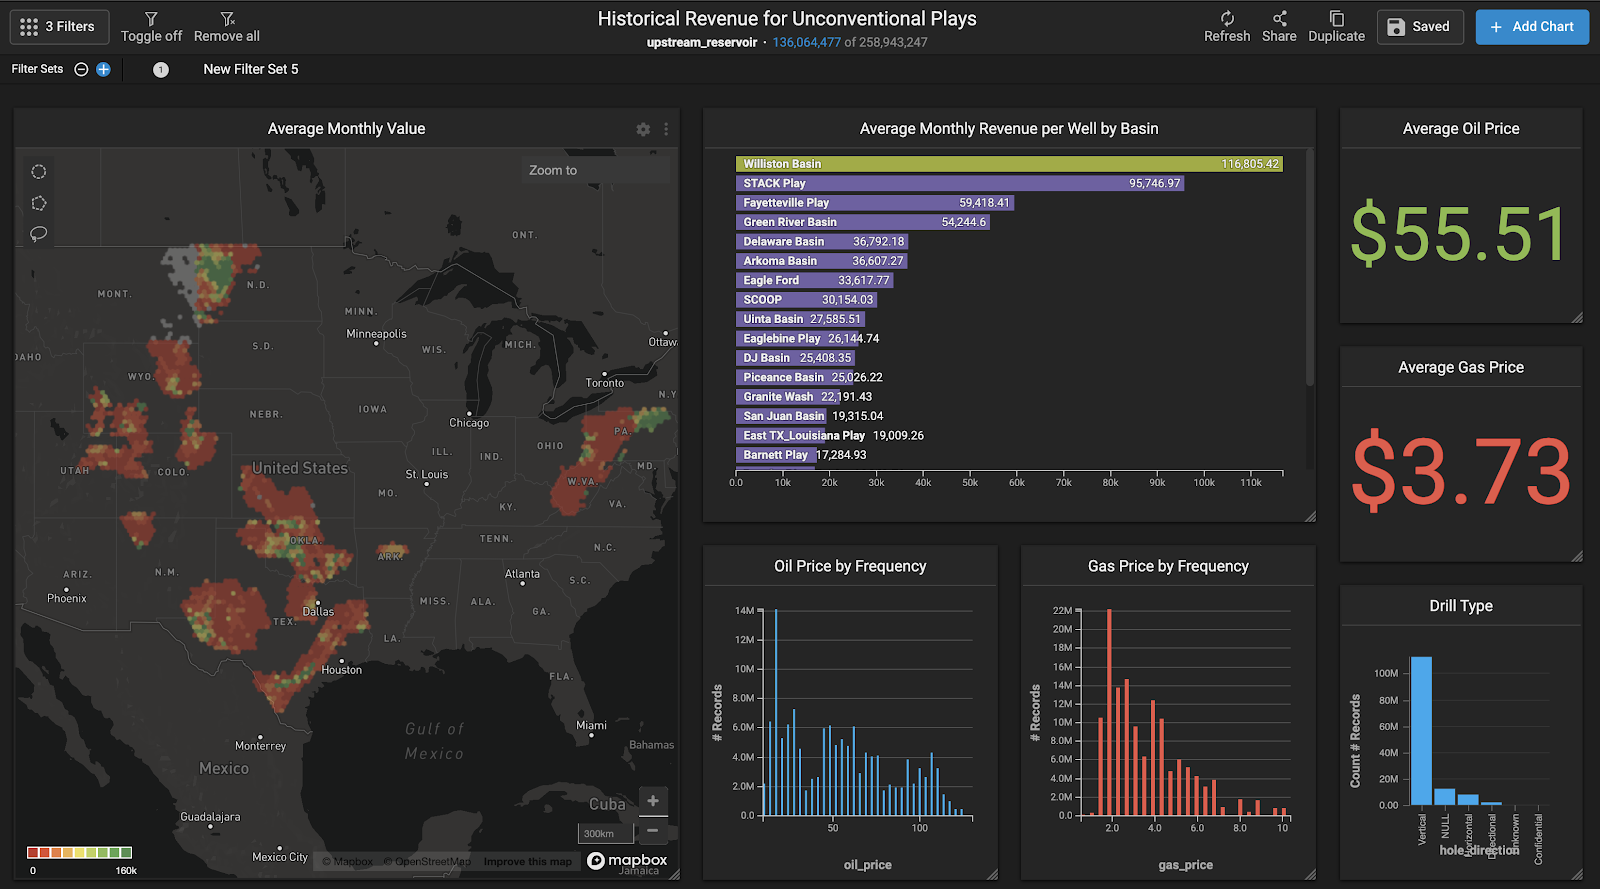
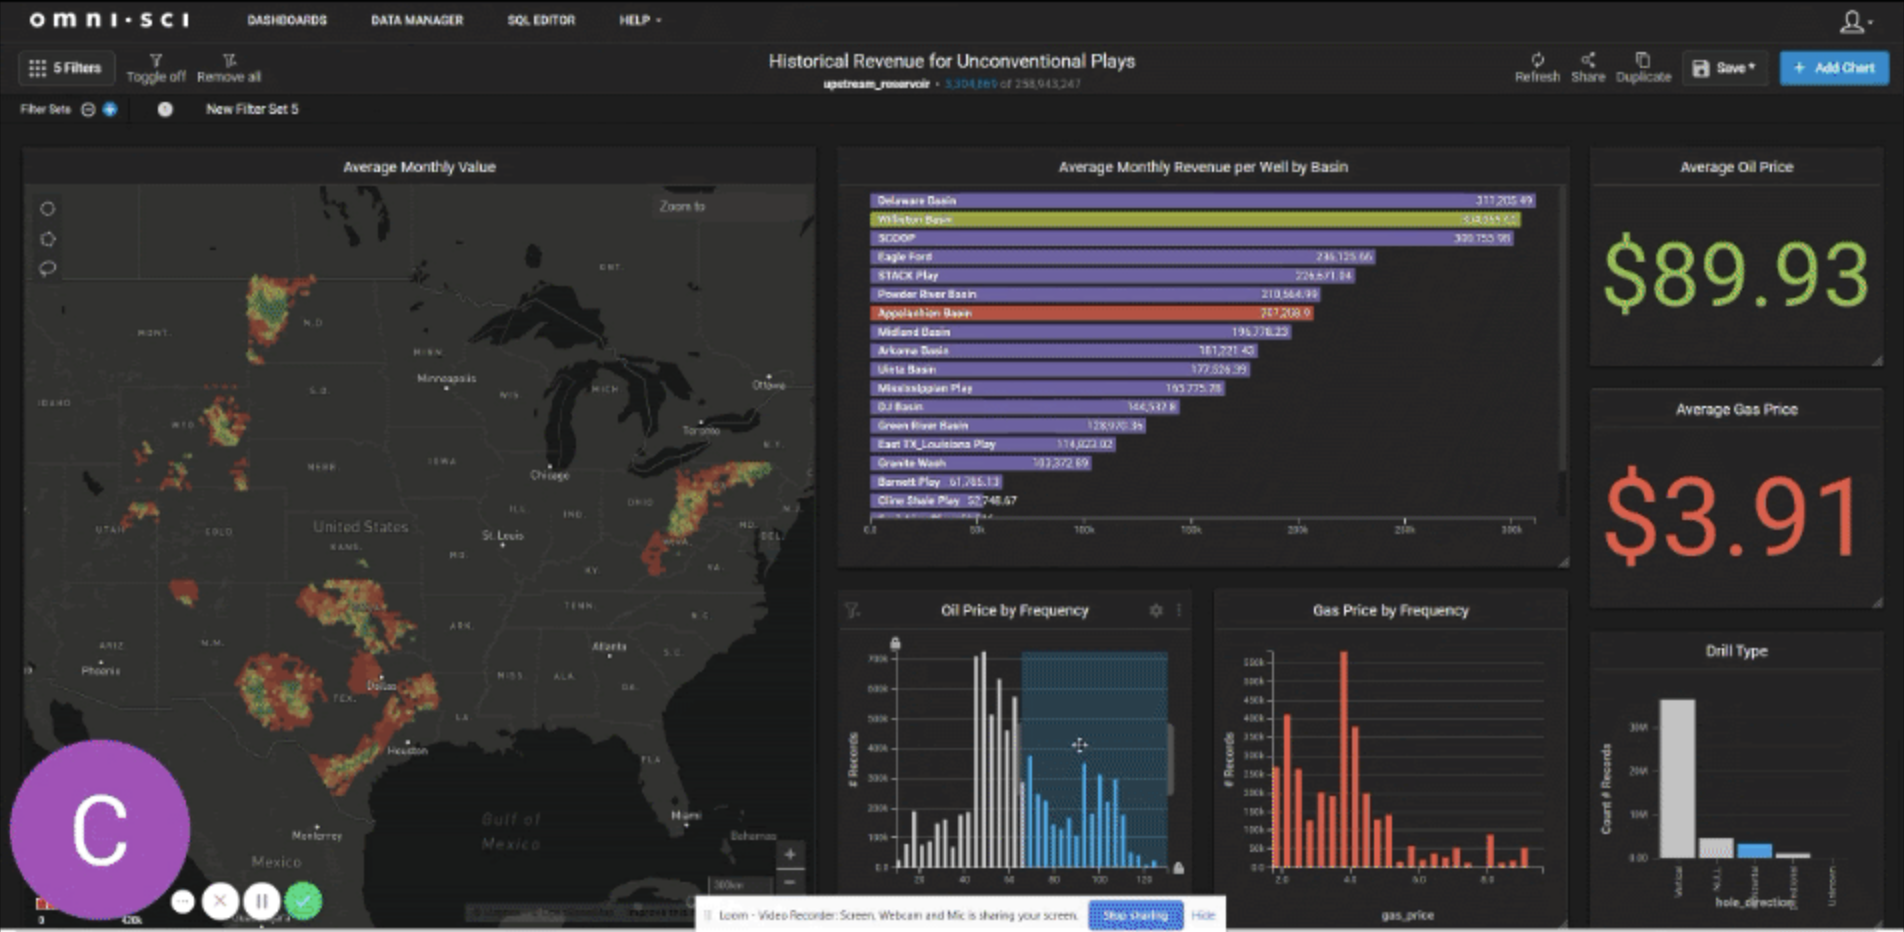
Now let’s tie in some revenue data. As mentioned above we’ve tied the average monthly historical West Texas Intermediate (WTI) oil price and the average US natural gas price to each row of monthly production data. Then we’ve multiplied the oil and gas production by these prices to create an estimated revenue or value field. This is a really fun dashboard to play around with.
An interesting use case for this is to filter by certain price ranges to see which plays and which areas within plays are most valuable at certain prices. Watch as we filter down to horizontal wells and look at ranges of high oil prices, low oil prices, and low oil prices combined with higher natural gas prices. As you might expect, The Williston Basin value is very high when oil prices are filtered above $70/bbl.
Next, when moving oil below $60/bbl and natural gas above $4/mcf the Appalachian Basin becomes the highest revenue play. Notice how the Delaware Basin remains high in either scenario, showing off the strength and diversity of the Delaware Basin play. Finally we’ll zoom into the Texas plays and see how the data changes dynamically as we move with focus.
Bringing in the dimension of time to analytical analysis adds an exponential amount of rows, but as you can see OmniSci handles this large dataset with ease. The ability to analyze these datasets in real-time allows for better collaboration and a conversational type of reservoir analytics.
Now think about all of the other reservoir analytics you can do on the fly. Things such as understanding b-factors and terminal decline parameters. Comparing these parameters across regions of the US, etc.
If you’re not a fan of aggregating and loading data you’ll be glad to know that the platform includes the regulatory data built-in and updated through a partnership with UpstreamDB. This reservoir database includes hundreds of millions production data rows and just the right amount of other key well level attributes for analytics. It’s been custom designed to work with the boosted GPU analytics power of OmniSci. Check out the demo to test drive yourself.
Also we challenge you to think of other large datasets you have and what valuable information you’d like to track. Importing or combining datasets is easy with OmniSci. No dataset is too large.
Learn how the OmniSci platform is revolutionizing data analytics in the oil & gas industry. Join us for a webinar on January 29 and see how, for the first time, companies can interactively inspect their data. Register here!


