
Seven Questions that Explain the Opioid Epidemic
Download HEAVY.AI Free, a full-featured version available for use at no cost.
GET FREE LICENSEExperience the power of accelerated analytics and interactively explore all the insights mentioned in this article from the OmniSci demos page.
Much has been written to date regarding the size and scope of the opioid epidemic in America, but until very recently it was difficult to make sense of the epidemic with actual data. However, in July of 2019 the Washington Post gained access to the Drug Enforcement Administration’s Automation of Reports and Consolidated Orders System, known as ARCOS, as the result of a court order. The data published by the Post represents all the shipments of all oxycodone and hydrocodone pills that wound up in the hands of consumers between 2006 and 2014. That’s over 310 million transactions and 120 billion pills!
While this is the largest and most in depth dataset to date on the opioid crisis, making sense of such large data can be difficult with many existing analytical tools. Fortunately, that’s where OmniSci comes in. Using the power of accelerated analytics we can interactively explore this valuable dataset to answer questions that shed a new light on this important issue.
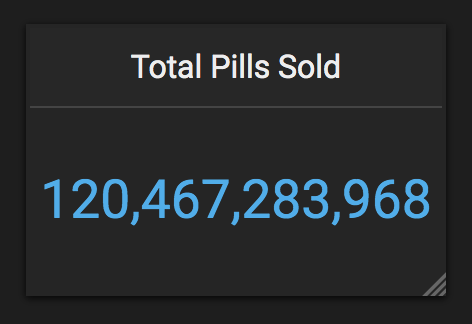
How many pills entered the market as the opioid epidemic raged from 2006 to 2014?
America’s largest drug companies saturated the country with over 120 billion opioid pills from 2006 through 2014 as the nation’s deadliest drug epidemic spun out of control.
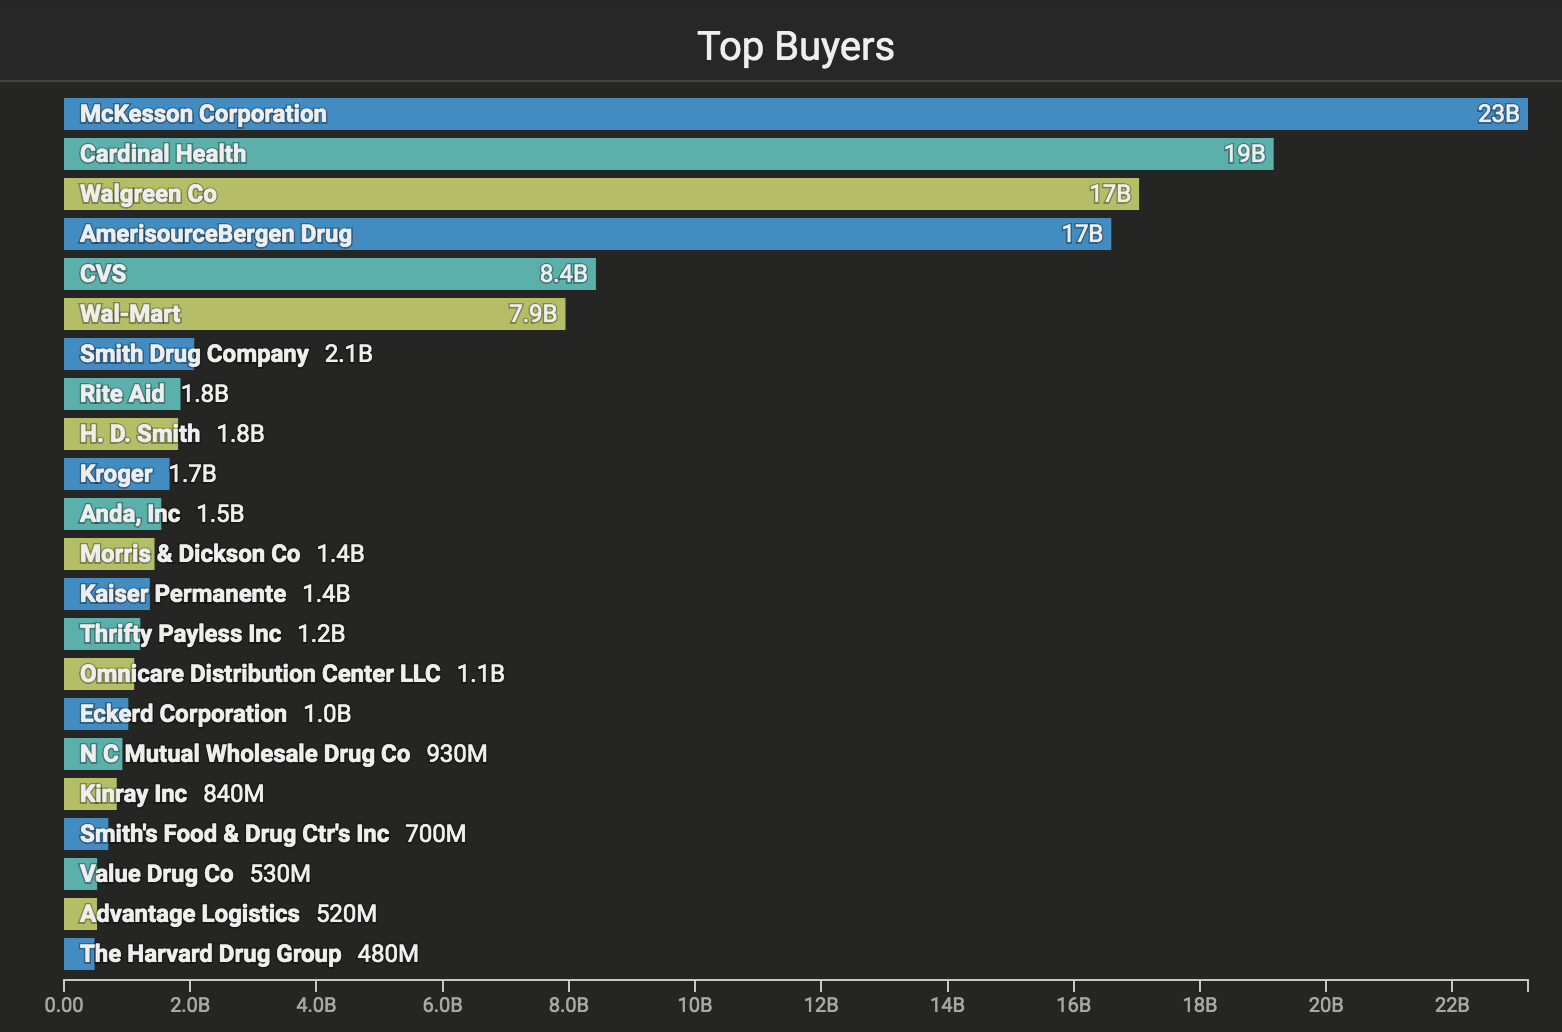
Who manufactured and distributed most of the opioids?
Just six companies purchased and sold 75 percent of the pills during this period: McKesson Corp., Walgreens, Cardinal Health, AmerisourceBergen, CVS and Walmart.
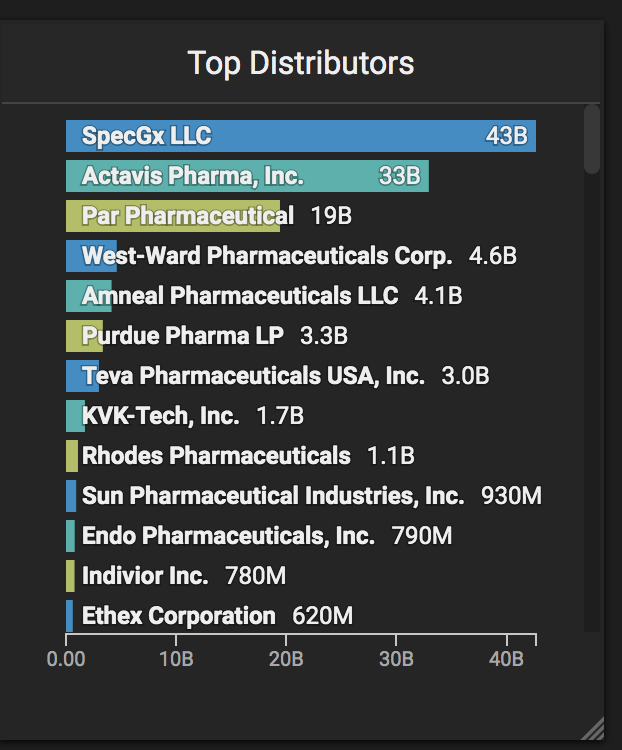
Three companies manufactured and distributed about 80 percent of the opioids: SpecGx, a subsidiary of Mallinckrodt; Actavis Pharma; and Par Pharmaceutical, a subsidiary of Endo Pharmaceuticals. It may be surprising to learn that despite all the news around Purdue Pharmaceutical, they only accounted for less than 3% of the total pills supplied to the market (though that the percentage still represents over three billion pills).
Where did most of the pills go?
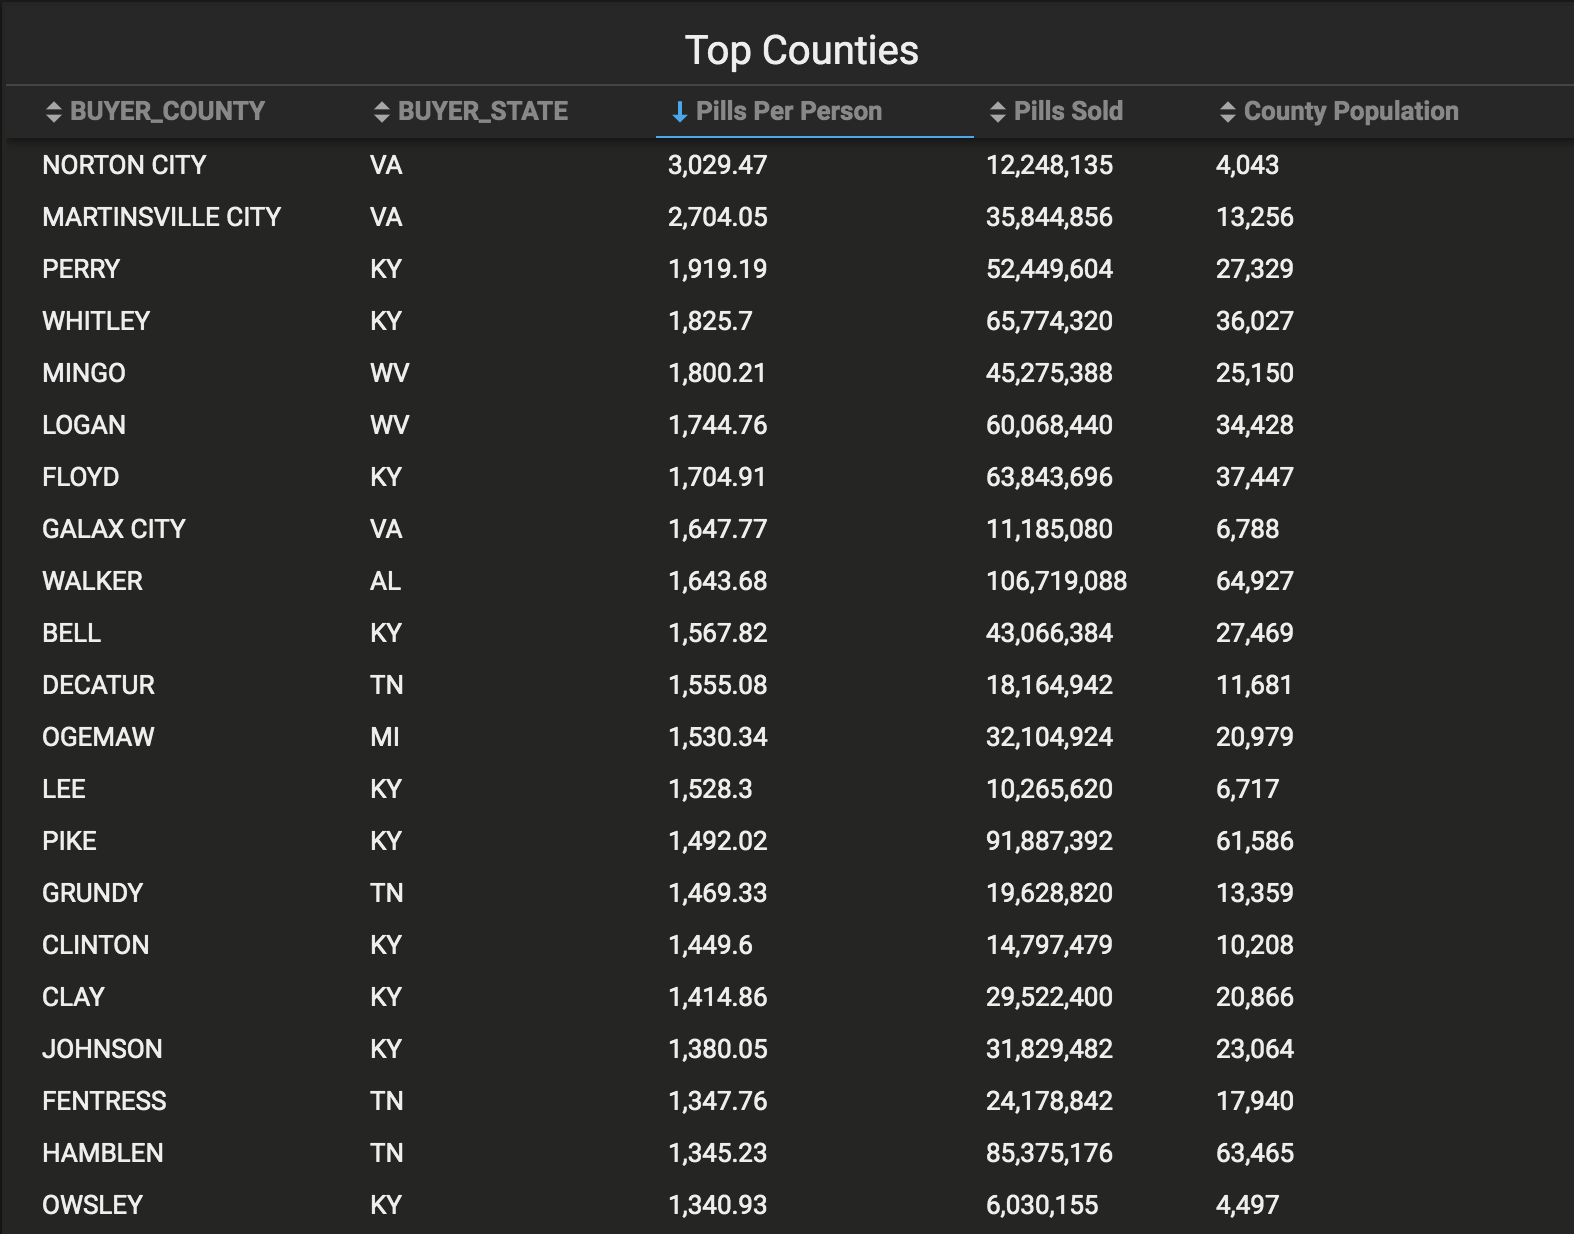
Using OmniSci, we can visualize the data by county to determine areas of higher opioid concentration. We’ve joined ARCOS data with county level population data from the 2010 US Census to determine how many pills per person were sold in each county. Once we have the data we can visualize on a map where most of the opioids went. While there are pockets of high opioids per person across the country the most prevalent counties exist in Appalachia.
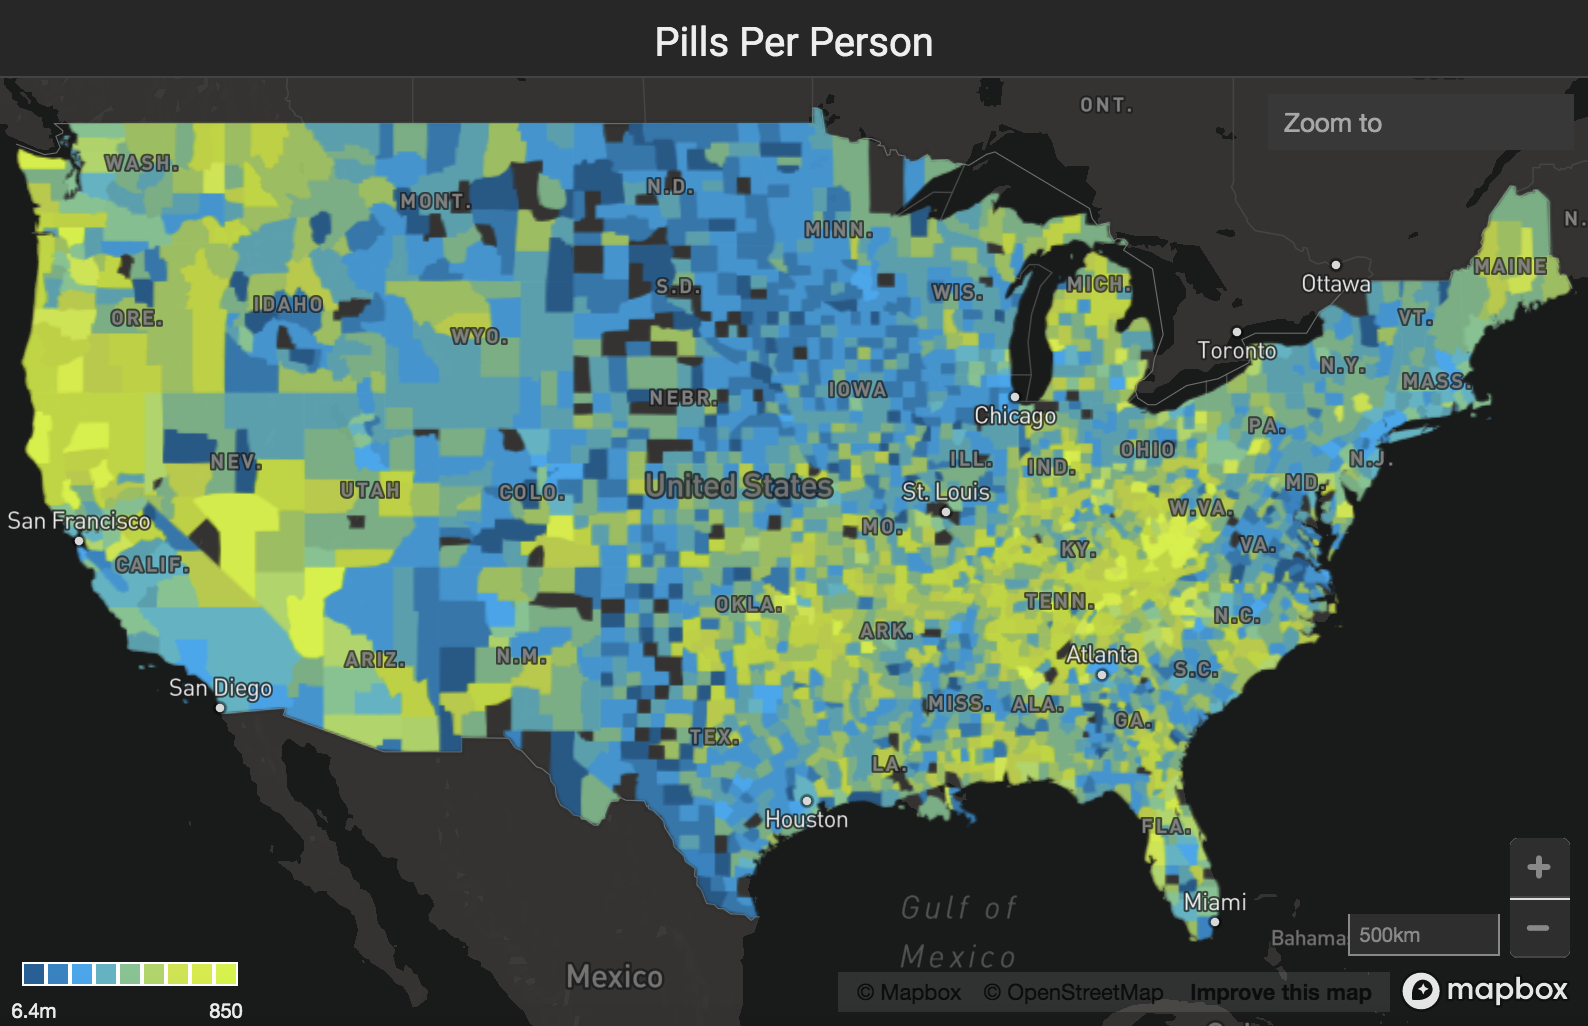
For further proof, we can see that almost all of the top 20 counties for pills sold per person are in that region. From 2006 through 2014 those counties had astonishing rates of opioid sales ranging from 1,340 opioid pills per person in Hamblen County, Tennessee to over 3,000 opioid pills per person in Norton City, Virginia.
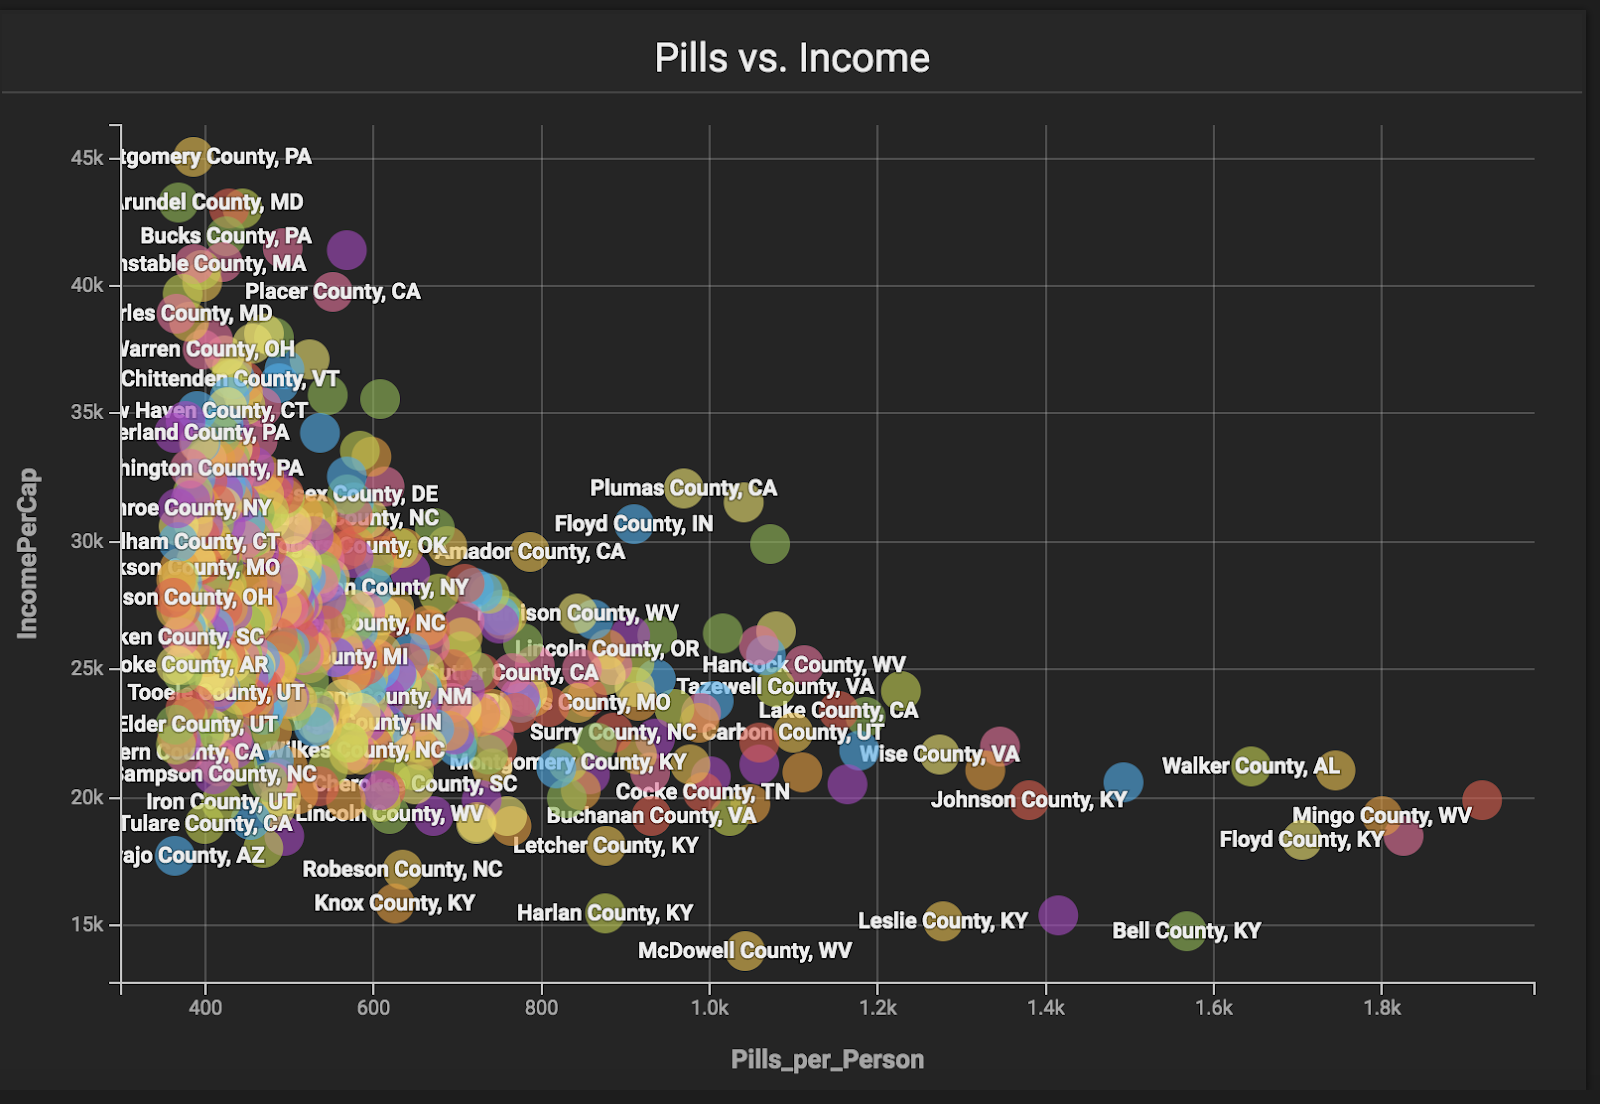
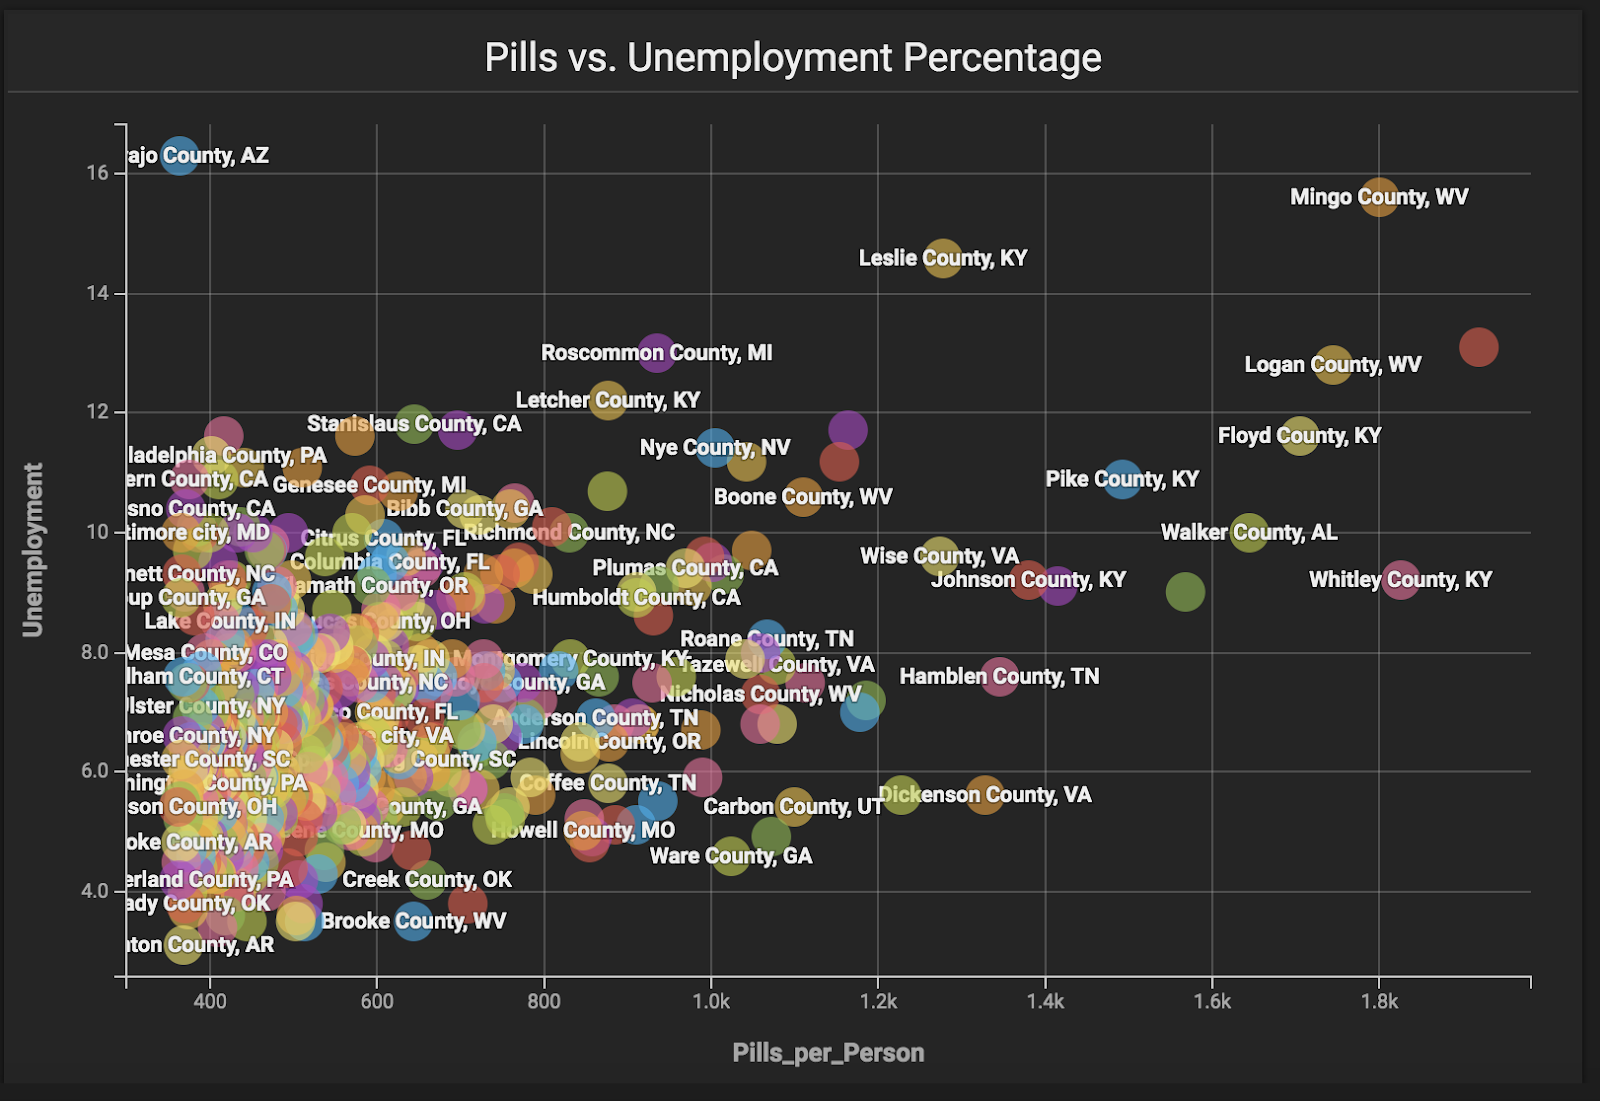
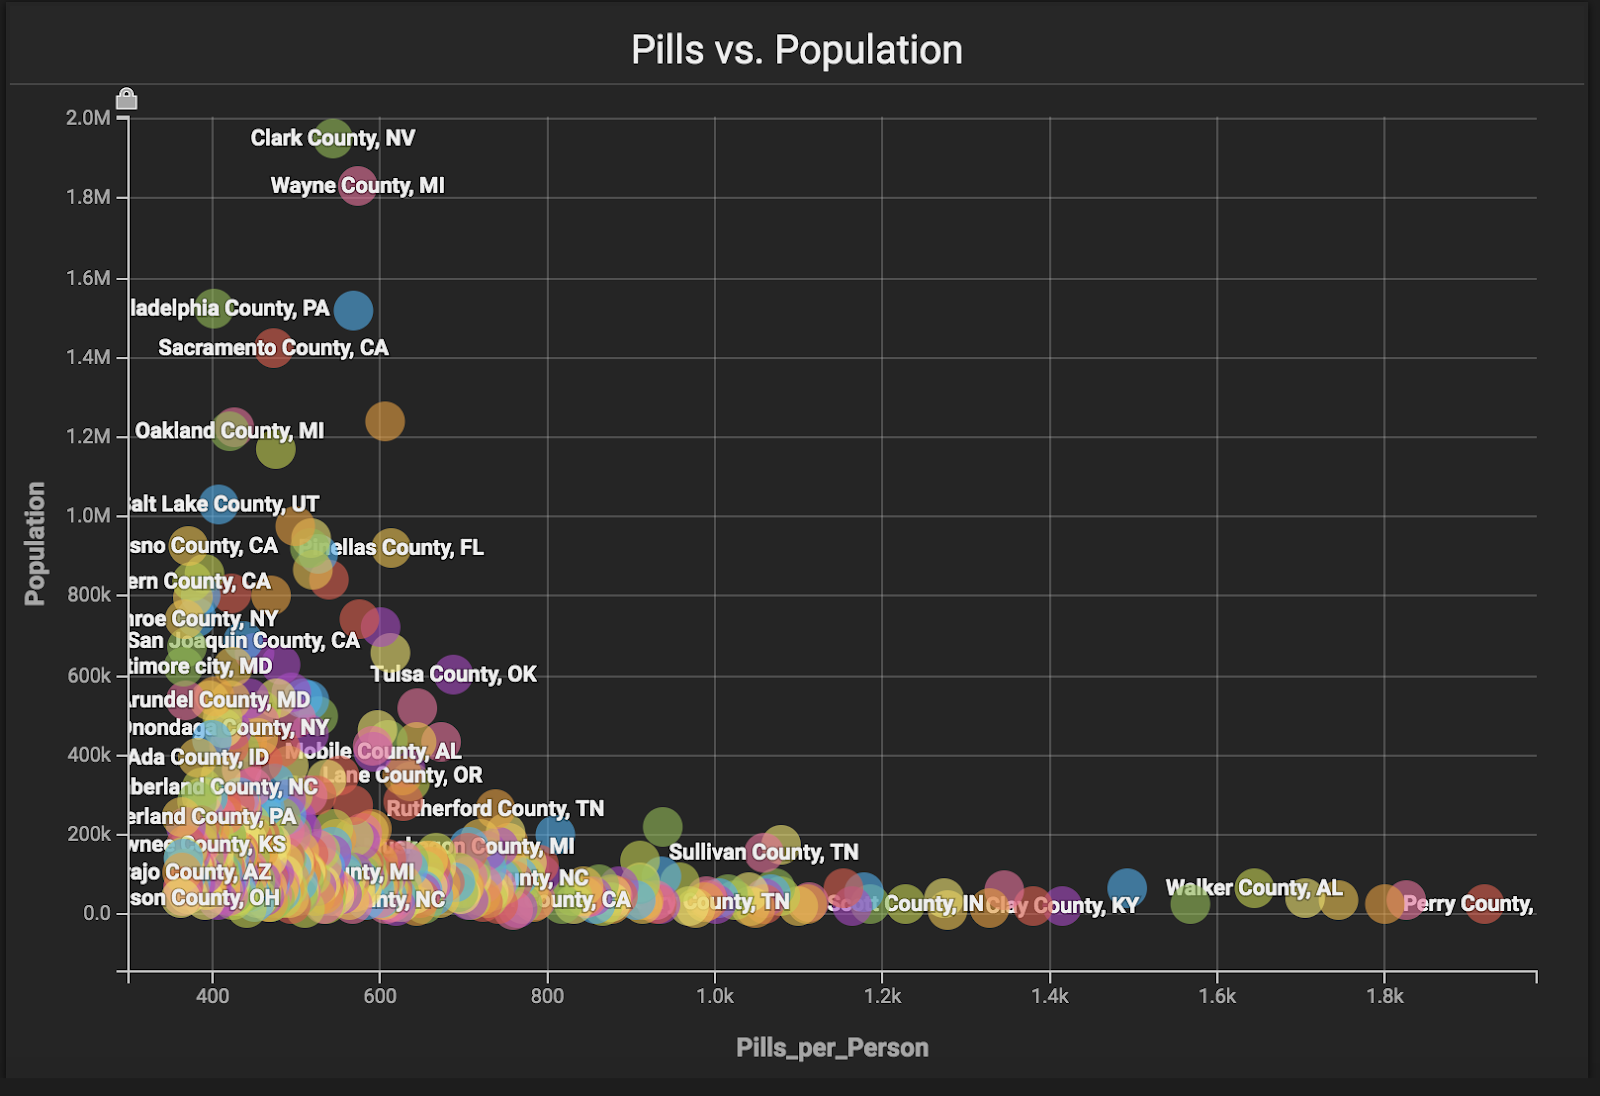
What were the characteristics of those counties with the most pills?
To determine if there are any commonalities besides location in the areas most heavily affected by the opioid epidemic we can chart the number of pills sold per person against any of measures reported in the census data. Taking a look at just three of them below it’s easy to visually understand how the opioid epidemic overwhelmingly affected counties with small populations where average income was low and unemployment was high.
How did the increase in opioids affect the number of opioid overdoses?
Let’s spend some time looking into the effect of all of these opioids nationwide. The latest release of OmniSci includes the powerful Visual Data Fusion (VDF for short) feature, which gives users the ability to combine measures from multiple data sources on the same chart and on a shared dimension such as time.
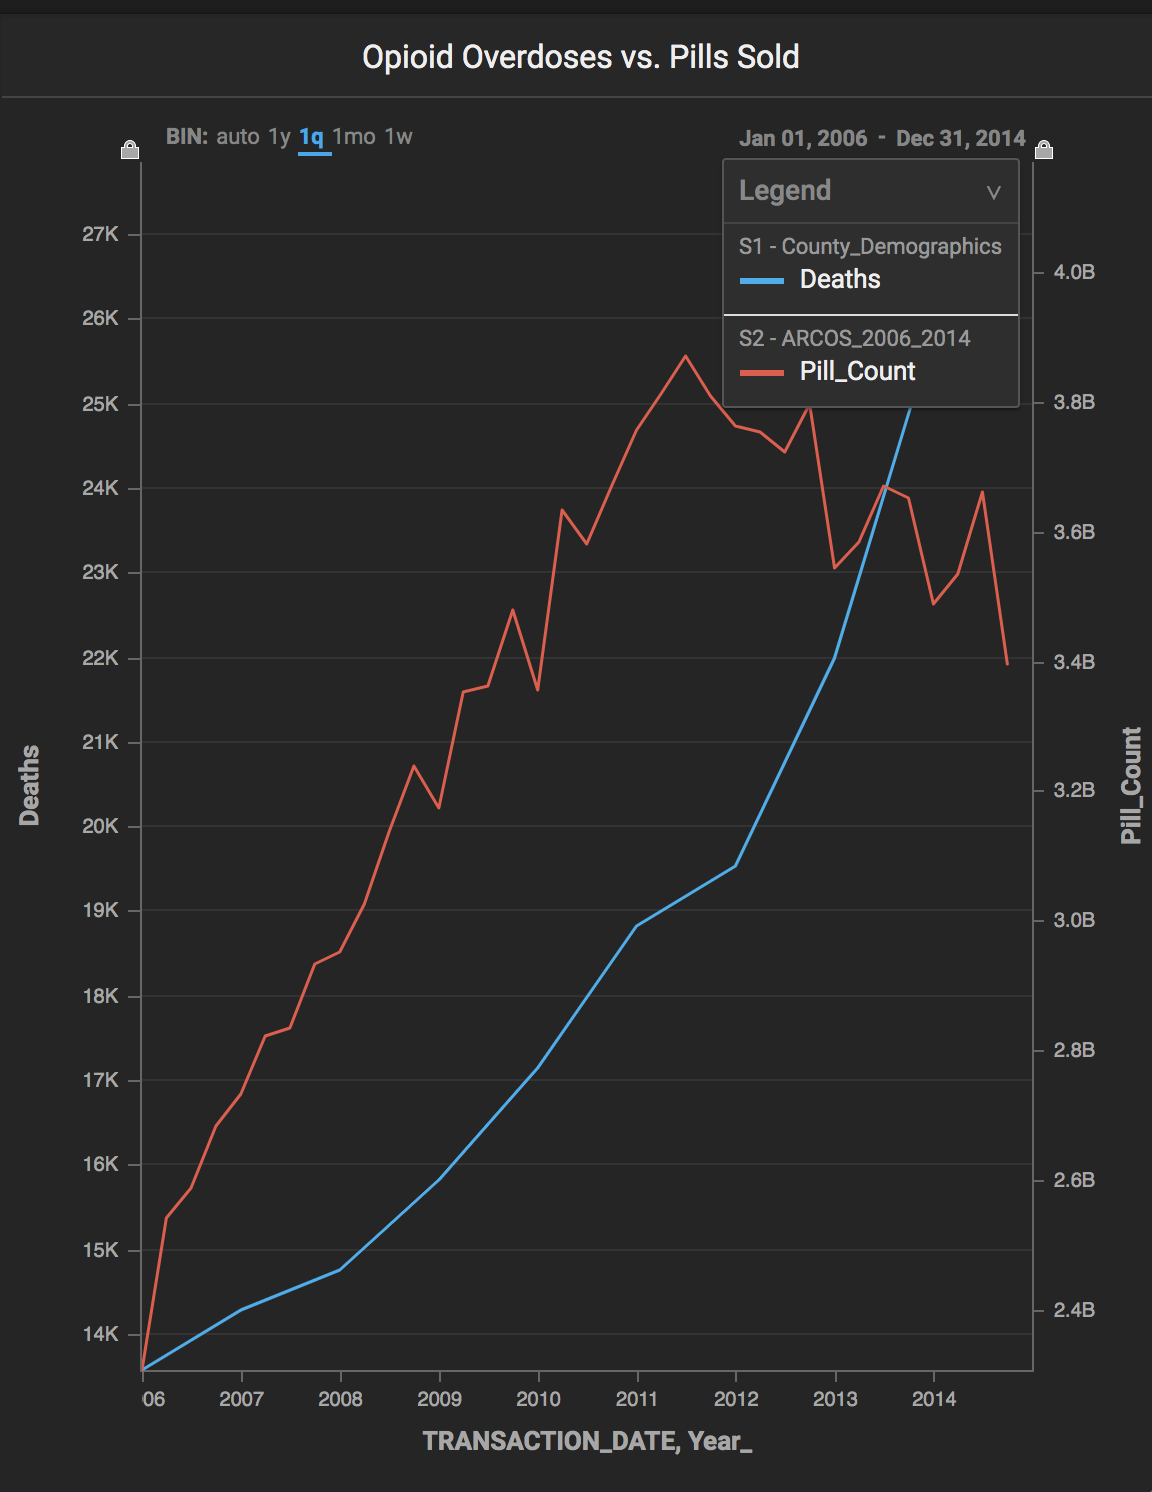
Using VDF we can bring in opioid overdose data from the CDC WONDER database and chart that against the number of pills sold over the same time period. The chart below gives some powerful proof of the direct correlation between the massive increase in opioids and lives lost to opioid overdoses.
Even as the number of opioids sold started to decrease in late 2011 opioid overdoses continued to rise through 2014. We would suspect this is primarily due to individuals turning to illegal opioids such as heroin once they could no longer obtain prescription opioids though the CDC data does not give us enough granularity to make that judgment.
Which counties were especially hard hit?
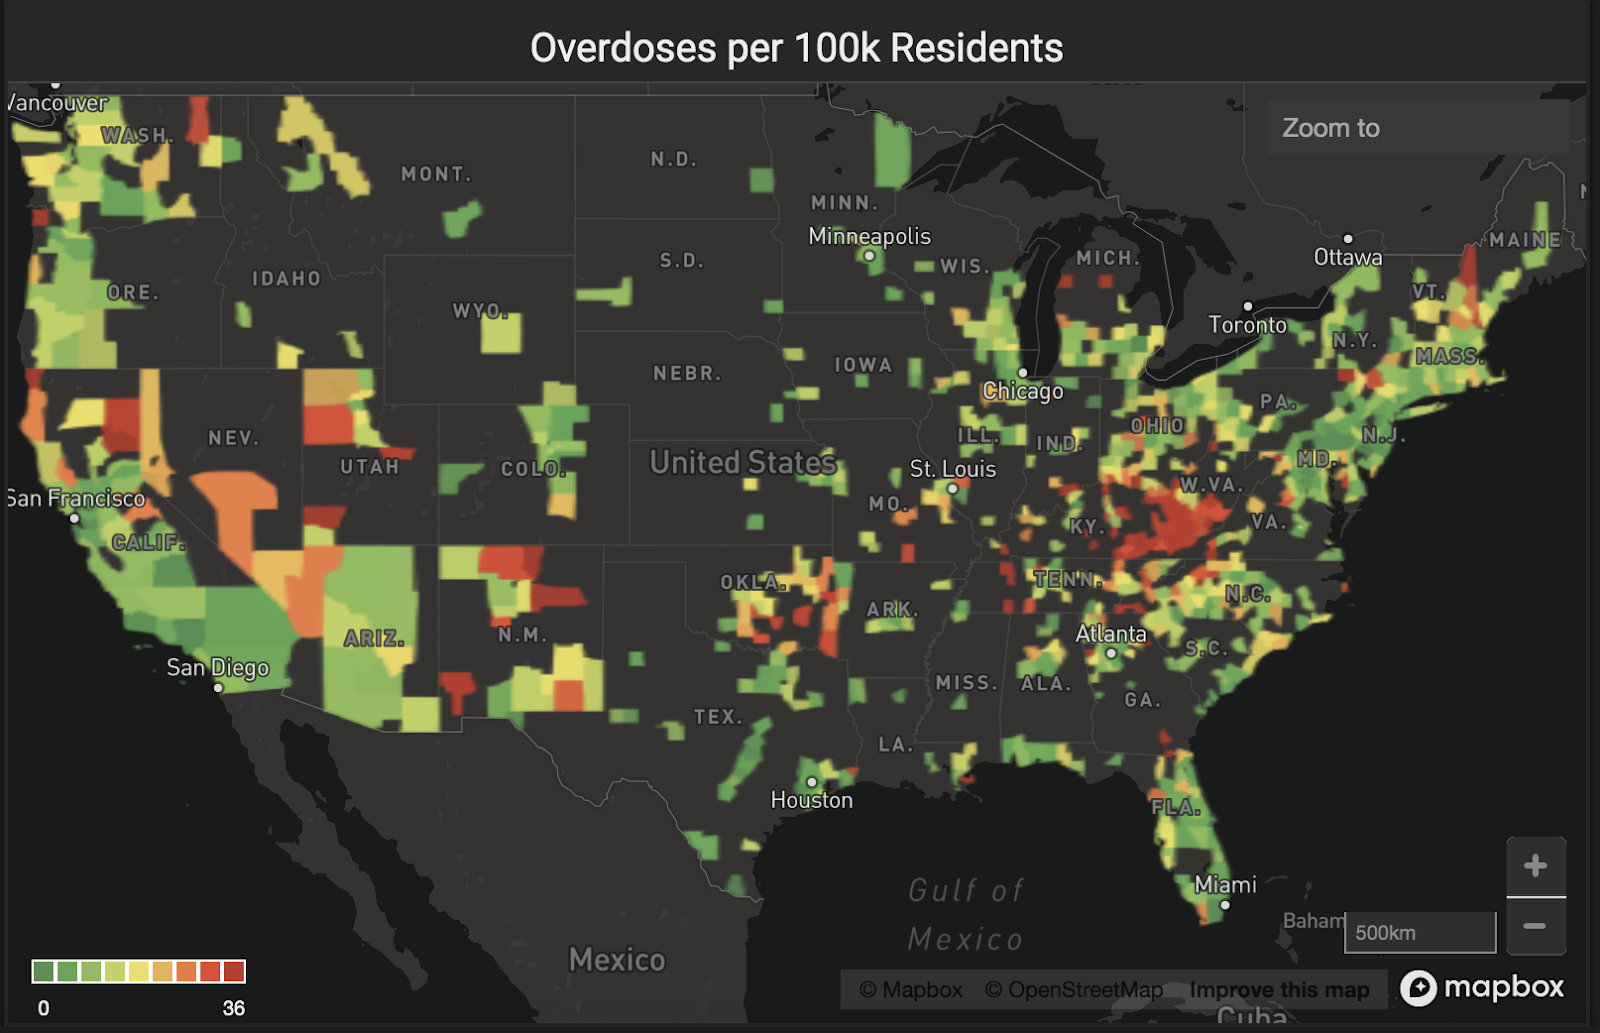
Using the interactive geospatial capabilities in OmniSci we can go from the nationwide data back down to the county level. Again, we can see the same geographic concentrations we saw earlier when mapping areas of high pill concentrations. Note: CDC does not report overdoses for any county with fewer than 10 overdoses.
How did the number of pills in a county affect overdoses?
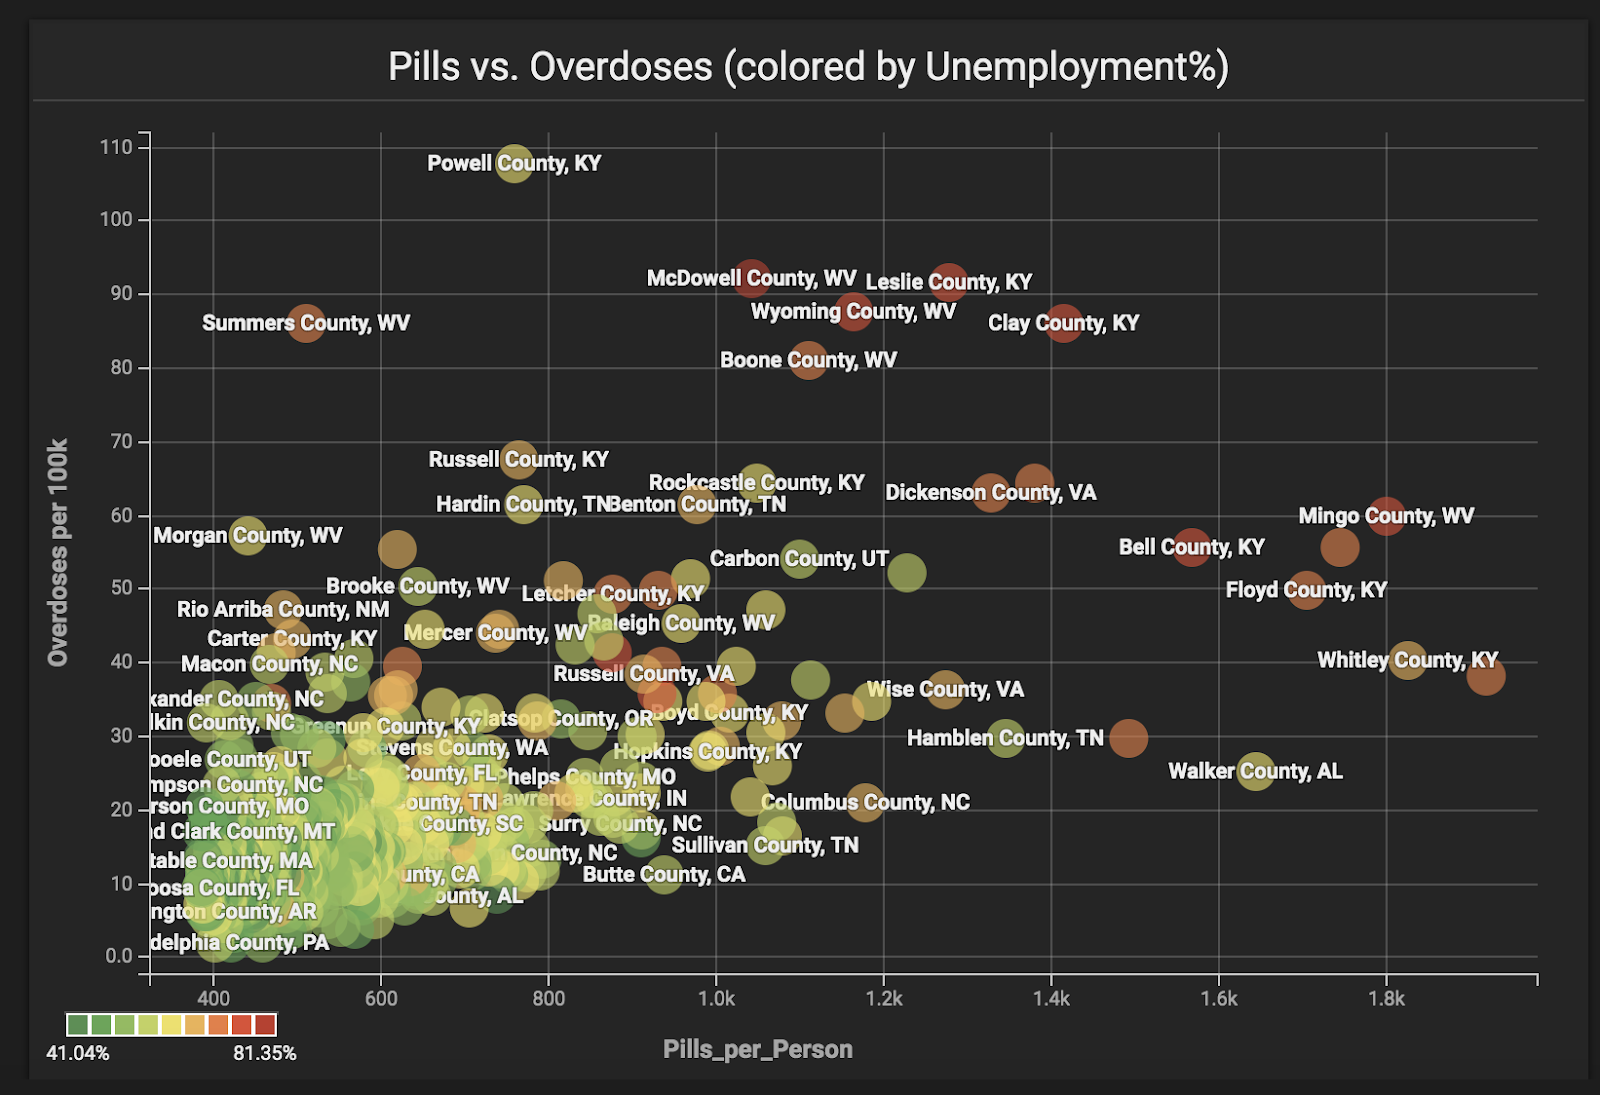
Finally, let’s take a look at how the prevalence of pills affected overdoses at a county by county level. Here we bring together many of the concepts already highlighted in this blog post to show how counties with some of the highest unemployment rates in the country were overwhelmed by a wave of opioids at the height of the epidemic and how that directly led to unprecedented levels in overdose deaths.
We encourage you to further explore this topic by taking a look at some of the outstanding reporting that’s already been done by the Washington Post and other media outlets and to dive into the data yourself using our interactive dashboard.
Stay tuned for a follow up in-depth blog post, where we will use OmniSci's recently announced data science tools integration to examine some specific, deeper questions on this dataset.
Questions or comments? Stop by the OmniSci Community Forum and let us know what you think!


