Bitcoin Transactions: From BigQuery to MapD
Download HEAVY.AI Free, a full-featured version available for use at no cost.
GET FREE LICENSEBitcoin, cryptocurrency, and blockchain technology were hot topics in many 2017 water cooler chats, especially after the meteoric rise in Bitcoin prices late last year. Despite Bitcoin’s popularity, very few of us, myself included, understand the inner workings of an actual Bitcoin transaction and how this growing public ledger is maintained.
But wait, I work for MapD - the most powerful visual analytics engine on the planet - and extremely large data sets are perfect fodder for MapD. So, I ingested the raw Bitcoin transactions into the MapD Core analytics database, along with other publicly available market data. Now, we can explore the correlations between the different datasets and visualize them in MapD Immerse visual analytics.
Later in this blog, I show how with a few clicks I was able to visually drill down into the transactions during the wild ride of late 2017 through early 2018, where I find all the million dollar transactions that involve the top 100 popular bitcoin addresses.
Steps
In this post, I detail the following steps:
- Source the raw data from Google BiqQuery and copy it to a bucket in Google Cloud Platform
- Source related market data from Quandl, a marketplace for financial, economic and alternative data, and download it locally
- Give MapD Server access to the cloud bucket using gsutil
- Using a Python application, merge the Bitcoin transaction data with other pertinent data and ingest the data into MapD Core
- Use MapD Immerse to chart and explore the data together
Bitcoin Data on BigQuery
There are many ways to download Bitcoin blockchain to examine the transactions. You can set up one of these Bitcoin clients which will download the entire blockchain, and you can extract the individual transactions from that. Setting up a Bitcoin client is resource intensive from a bandwidth, storage and computing perspective. So I used Google's BigQuery, which I find to be the easiest way to get all of the Bitcoin transactions with the least amount of setup time. Of course, you need an account on Google and access to Google Cloud Platform. Bitcoin blockchain transaction data is now available on BigQuery's bigquery-public-data:bitcoin_blockchain dataset and is updated every 10 minutes.
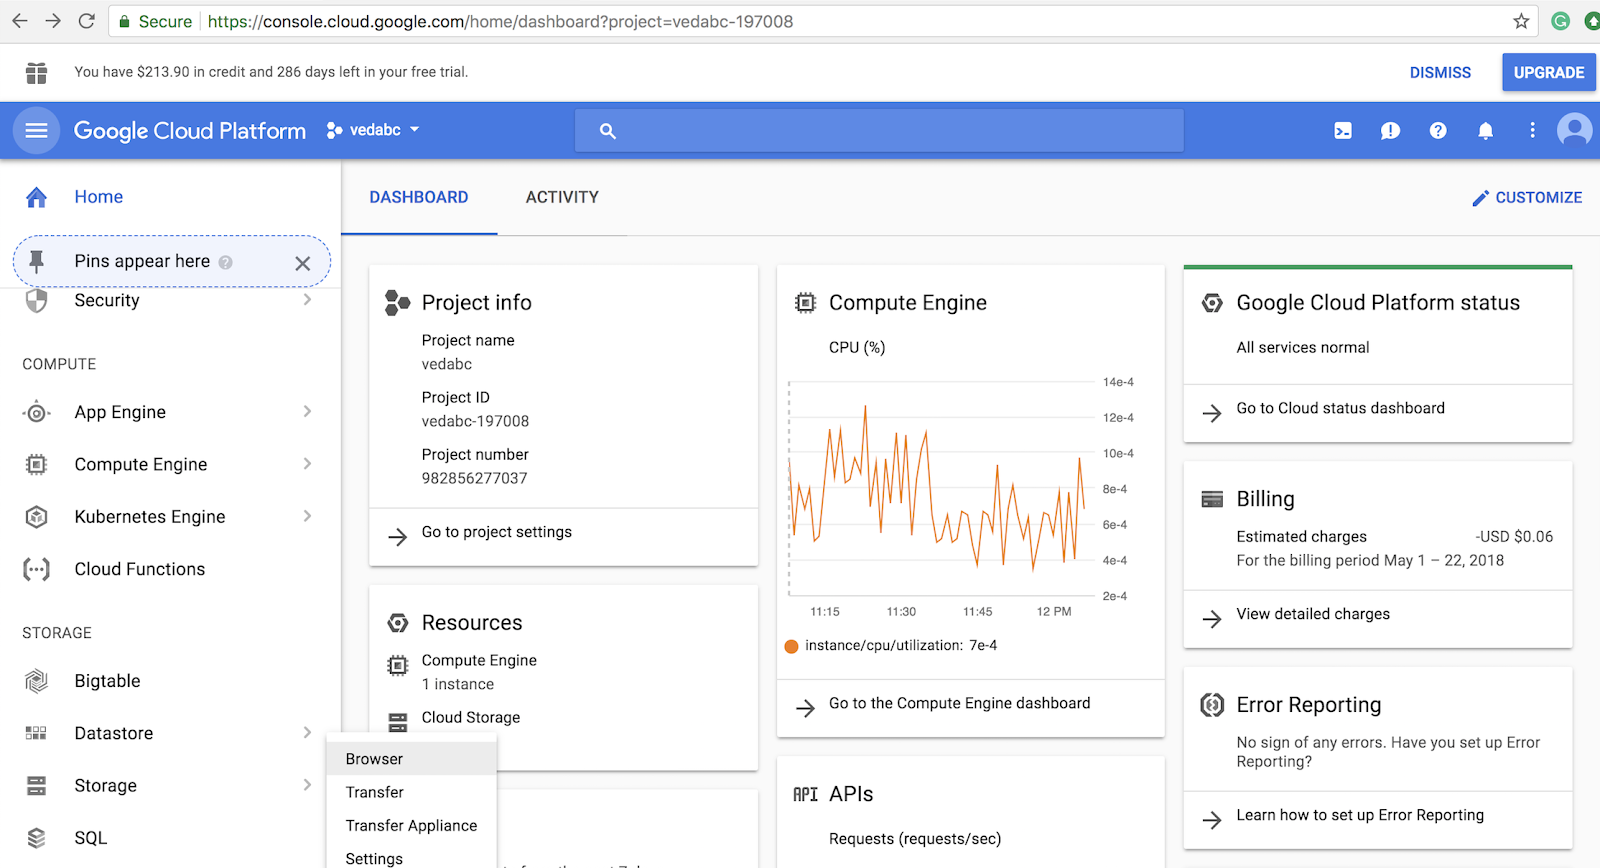
Before we query and export the data from BigQuery, you need to create a Bucket on Google Cloud Platform Storage to store all the transaction objects. Go to Google Cloud Platform dashboard and select Storage.
On the Storage dashboard, select CREATE BUCKET and give a unique name to the bucket.
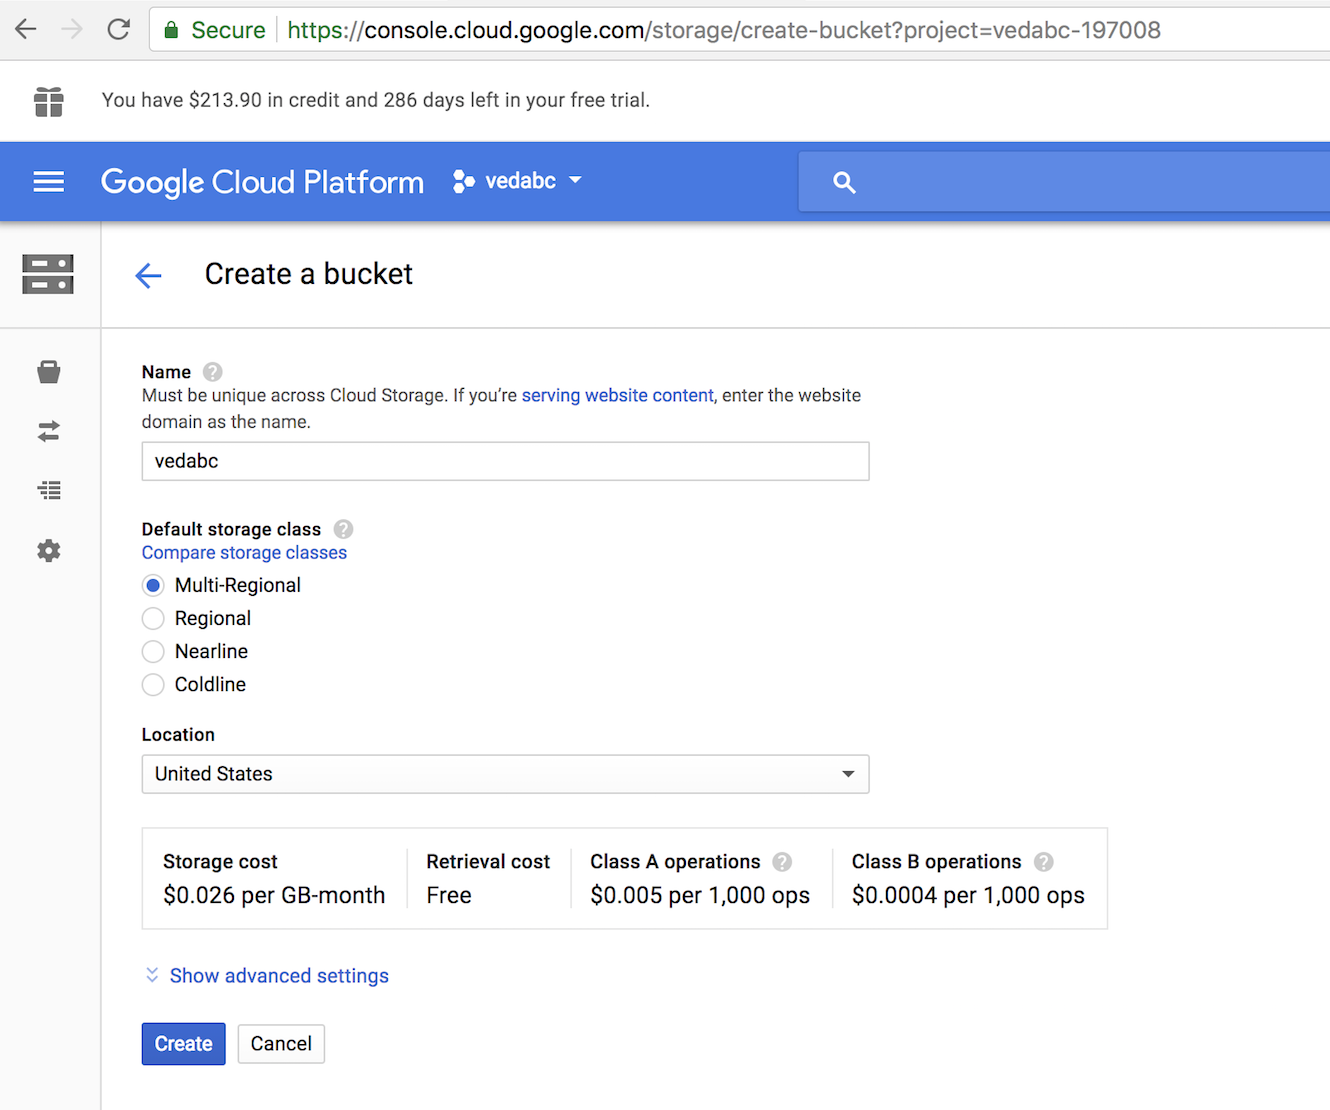
Make sure that the newly created bucket appears on the bucket list on the storage browser page. Now you are ready to use this bucket to download the Bitcoin transactions.
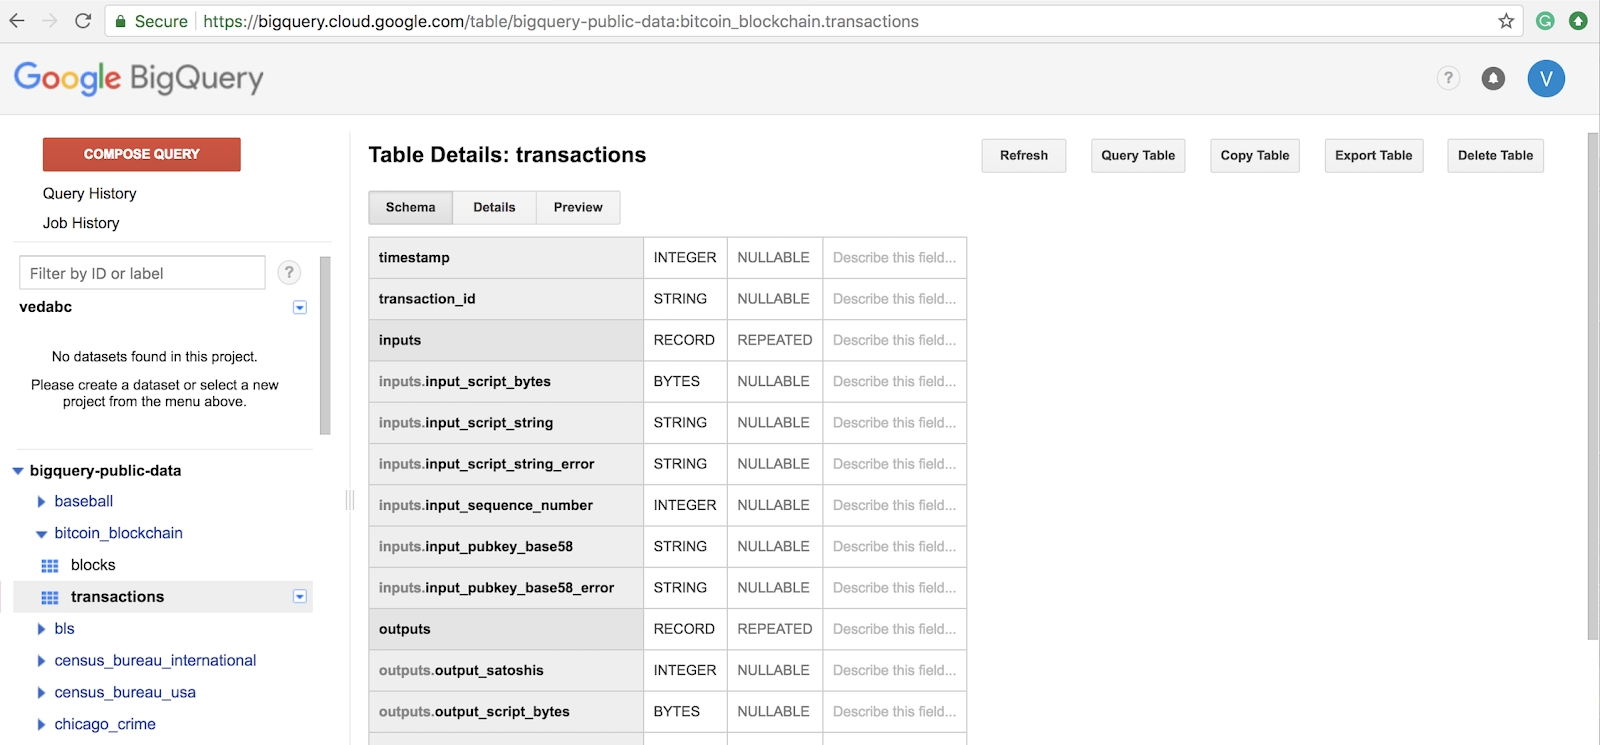
Go back to Google BigQuery and select bigquery-public-data -> bitcoin_blockchain -> transactions.
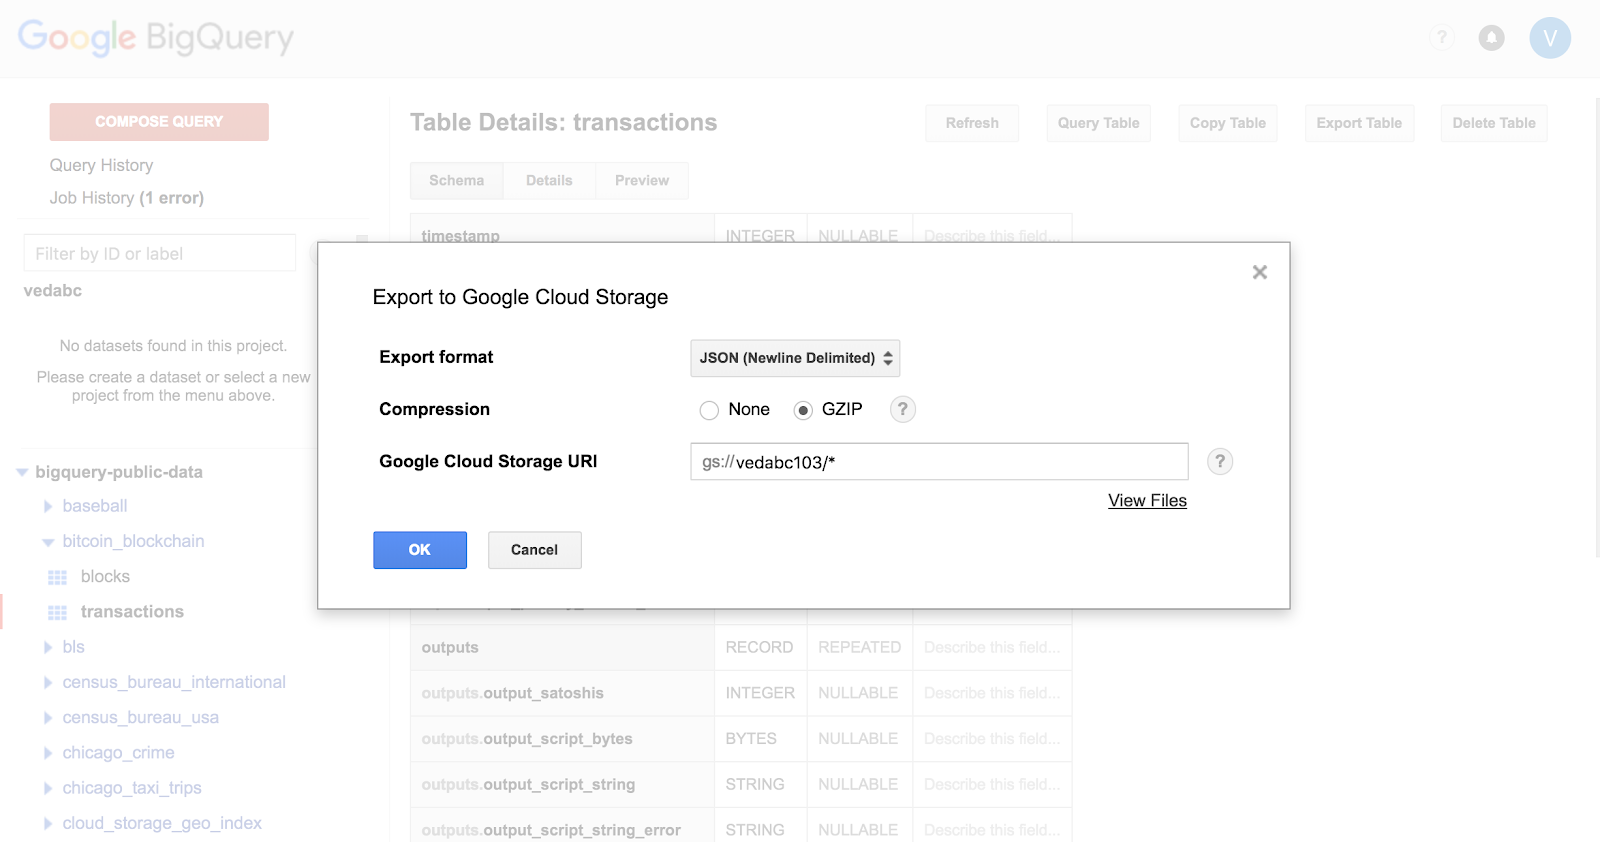
Use the Export Table option to export all the bitcoin transactions to the newly created cloud storage bucket. Notice that we have selected the export format to be JSON and enabled compression.
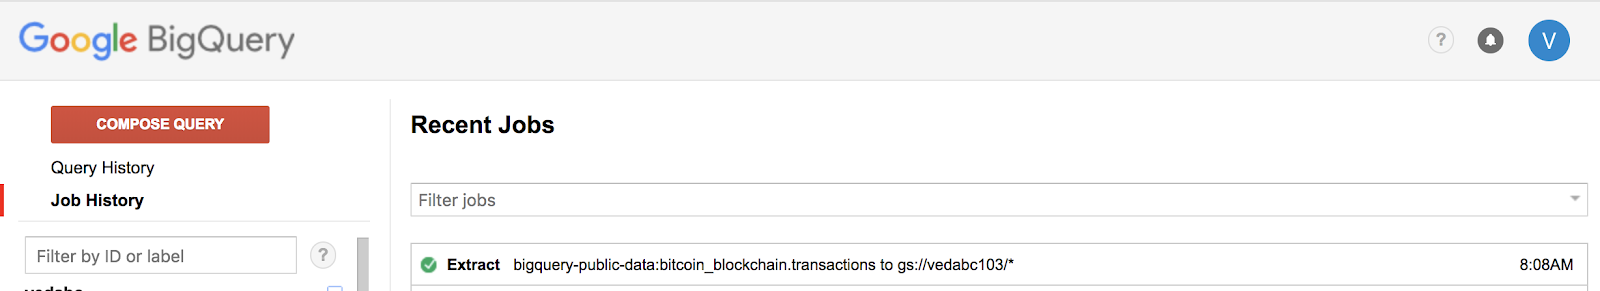
Click on Job History to monitor the progress of the export task. The task will run for couple of minutes and report success with a green check mark (see below).
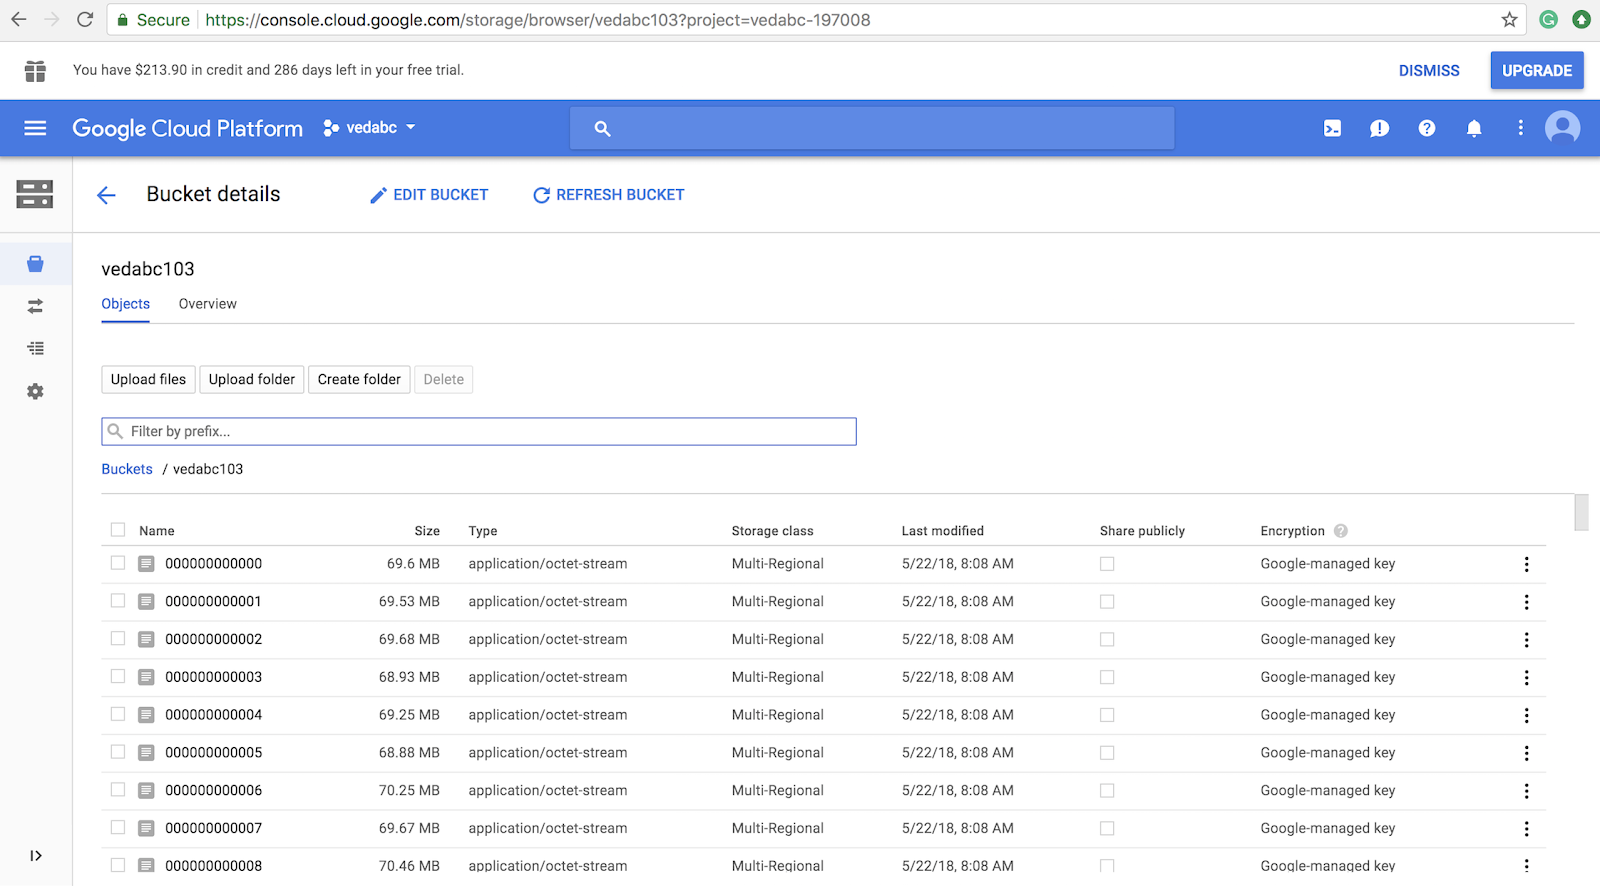
You should also click on the bucket under the Storage Browser and see thousands of objects which are gzipped Bitcoin transactions.
Bitcoin Data on QUANDL
The Bitcoin blockchain transaction information you downloaded from BigQuery contains details on each transaction like the date, the amount of Bitcoin value that is transferred from one Bitcoin address to another, block information, etc. You will find detailed information about all the fields that comprise a transaction under Table Details: transactions -> Schema.
This raw data from each transaction on its own is not very interesting if you are not mining or validating the transaction. If we combine this raw transactional information with market data on Bitcoin then we can see interesting patterns and highlight trends on this fascinating financial instrument.
Quandl is a platform for financial, economic and alternative data that serves investment professionals. Quandl sources data on Bitcoin Blockchain and updates on various interesting Bitcoin related metrics on a daily basis. The data can be downloaded as a CSV file for each individual metric. You can select whatever metrics interest you; I downloaded the following metrics:
- BCHAIN/MKPRU Bitcoin Market Price in US Dollar
- BCHAIN/ETRVU Bitcoin Estimated Transaction Volume in US Dollar
- BCHAIN/TRFUS Bitcoin value of transaction fees miners earn per day in US Dollar
- BCHAIN/NTRAT Total Number of Unique Transactions per day
- BCHAIN/NADDU Number of unique Bitcoin addresses used per day
- BCHAIN/NTREP Number of Transactions Excluding Popular Addresses
- BCHAIN/DIFF Bitcoin Difficulty
Each of these metrics is updated daily and can be downloaded as a CSV file, which has two fields - date and metric value. I joined these CSV files into a single CSV file (btc_quandl.csv) using the date field as a key. I also downloaded the 100 most popular Bitcoin addresses into the CSV file popular_btc_addresses.csv.
gsutil - Accessing Google Cloud Storage
gsutil is a tool that enables you to access Google Cloud Storage from the command-line. gsutil is part of the Google Cloud SDK, but I cover the standalone installation of gsutil because it’s the only tool required to access the cloud storage. For detailed instructions on installing Google Cloud SDK/gsutil, please refer to the website Install gsutil.
Use gsutil to access the Bitcoin transaction data that you downloaded to your Cloud Storage bucket. Install gsutil on the MapD server if you have shell access so that the data can be ingested directly from Cloud Storage into MapD table after preprocessing without involving any intermediary server. If you don’t have shell access, gsutil and the preprocessing scripts can be installed on any Linux server for staging the data before uploading it to MapD.
- Download gsutil as gsutil.tar.gz
- Extract the files into your home directorytar xfz gsutil.tar.gz -C $HOME
- You will notice that a gsutil directory is created which contains the tool and associated files.
- Add gsutil to your PATH environment variable exportPATH=${PATH}:$HOME/gsutil
- To authenticate gsutil to have access to your cloud storage, typegsutil config
- You will be prompted with a URL for the authorization page where you can authorize gsutil to access Cloud Storage. The gsutil dialog looks similar to the following:
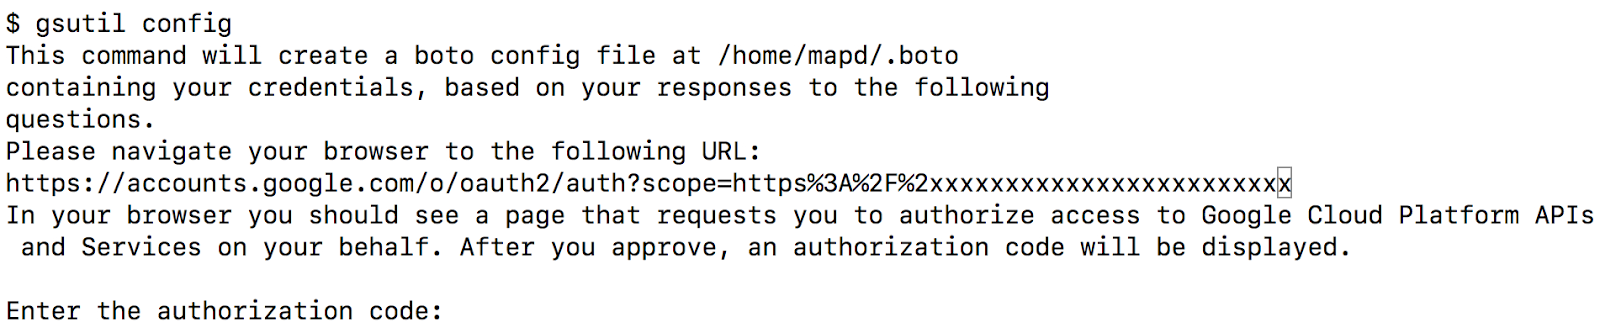
- Copy and paste the URL into a browser window. If prompted, sign in with the Google account associated with your Cloud Storage data in the browser window.
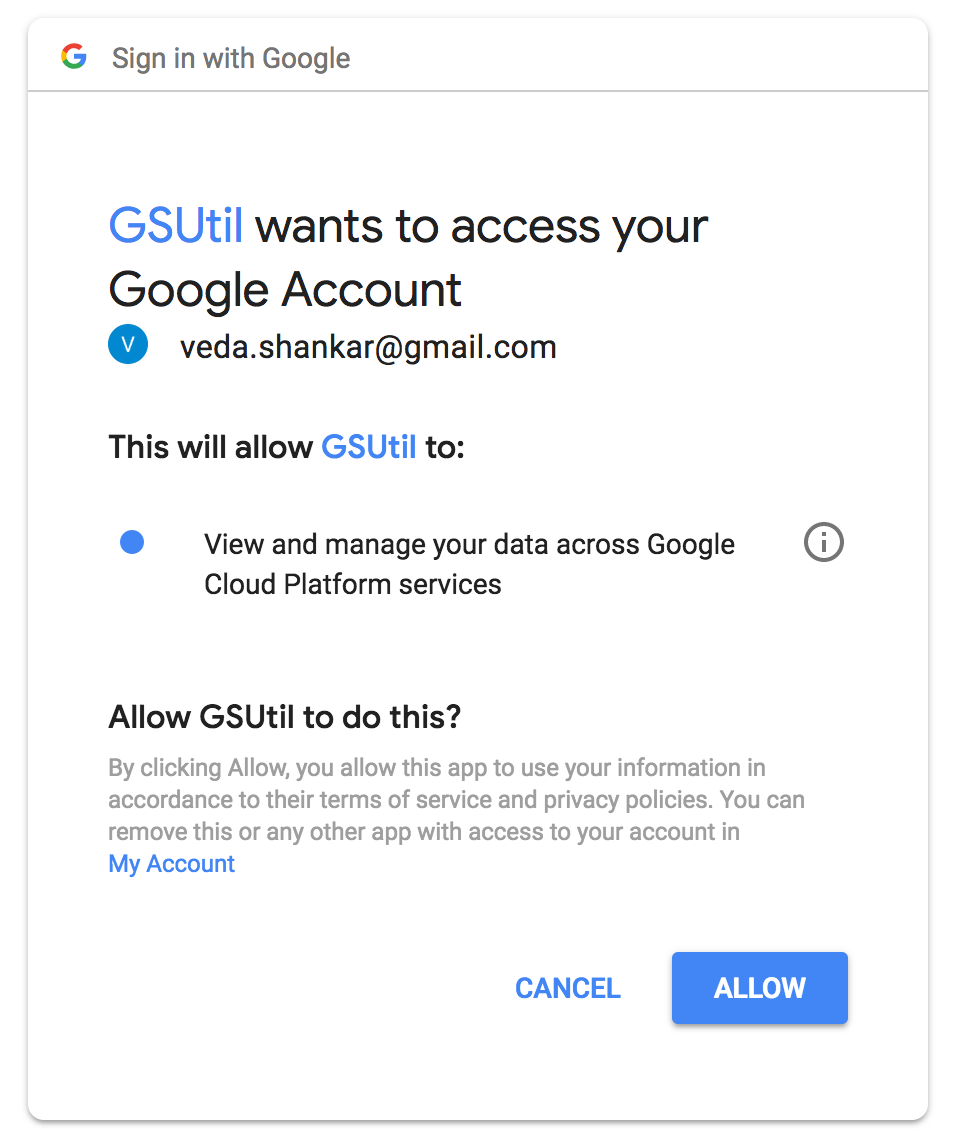
- Click the Allow Access button. This authorizes gsutil to access Cloud Storage.
- Copy the authorization code that appears on the next page into the gsutil prompt and press Enter. After you provide an authorization code, gsutil prints the following:
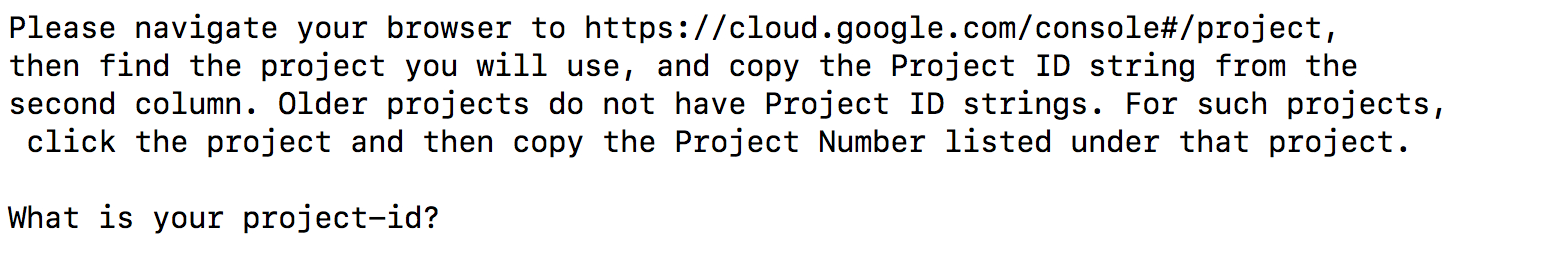
- Log in to the Google Cloud Platform Console to find a project ID. Find the ID by clicking Manage all projects found in the drop-down in the upper right and enter it at the gsutil prompt.
- Confirm that you can now access your cloud storage by typing:gsutil ls
Workflow for ingesting Bitcoin transactions into MapD
The list below captures the workflow for transferring from Storage Cloud each object containing the Bitcoin transactions in compressed JSON format to a CSV format that can be ingested into a MapD table. The application has been written in Python and you can download the code from its github repo.
The Python application performs the following steps for each object in the Storage Cloud bucket:
- Copy Object from Storage Cloud to chunk.json.gz
- Gunzip chunk.json.gz
- Execute btc_json2csv() to extract transactions from JSON format to CSV format
- Created btc_chunk.csv
- Read btc_chunk.csv and btc_quandl.csv (merged tables of all BTC metrics) into Pandas data frames
- Perform an inner merge on the two data frames using the transaction_date field
- Insert columns input_address_type & output_address_type
- Set the address type to either ordinary or popular based on whether the Bitcoin address in the transaction belong to the Top 100 popular Bitcoin address list (popular_btc_addresses.csv)
- Write out the data frame to a CSV file btc_chunk_final.csv
- Connect to MapD
- Create MapD table if it does not exist
- Using COPY FROM command load data into MapD table
- Close connection to MapD
A MapD table is created with the following columns:
Column Name
Data Type
Column Name
Data Type
transaction_date
DATE
block_id
TEXT ENCODING DICT(32)
transaction_fees_usd
FLOAT
prev_block_id
TEXT ENCODING DICT(32)
transaction_volume_usd
FLOAT
input_sequence
BIGINT
btc_difficulty
FLOAT
input_pubkey
TEXT ENCODING DICT(32)
btc_price_usd
FLOAT
output_pubkey
TEXT ENCODING DICT(32)
btc_addresses_used
FLOAT
output_satoshis
FLOAT
transactions_exclude_popular
FLOAT
input_address_type
TEXT ENCODING DICT(32)
total_transactions
FLOAT
output_address_type
TEXT ENCODING DICT(32)
transaction_datetime
TIMESTAMP
output_btc
FLOAT
transaction_id
TEXT ENCODING DICT(32)
Creating Charts in MapD Immerse
With the Bitcoin transaction data now loaded into MapD, we are ready to explore it! Connect to Immerse at port 9092 on the MapD server instance with your browser. Using MapD Immerse you can visually interact and analyze the vast trove of raw Bitcoin transactional data and discover interesting facts, which may be hard to find in extremely large datasets. Immerse provides instantaneous representations of your data, from basic charts to rich and complex visualizations. Charts are comprised of measures and dimensions. Measures are quantitative, numerical values or aggregated values (SUM, AVG, etc). Dimensions categorize measures and are used for grouping of data. A detailed explanation of the different chart types and Immerse features can be found in the Immerse User Guide.
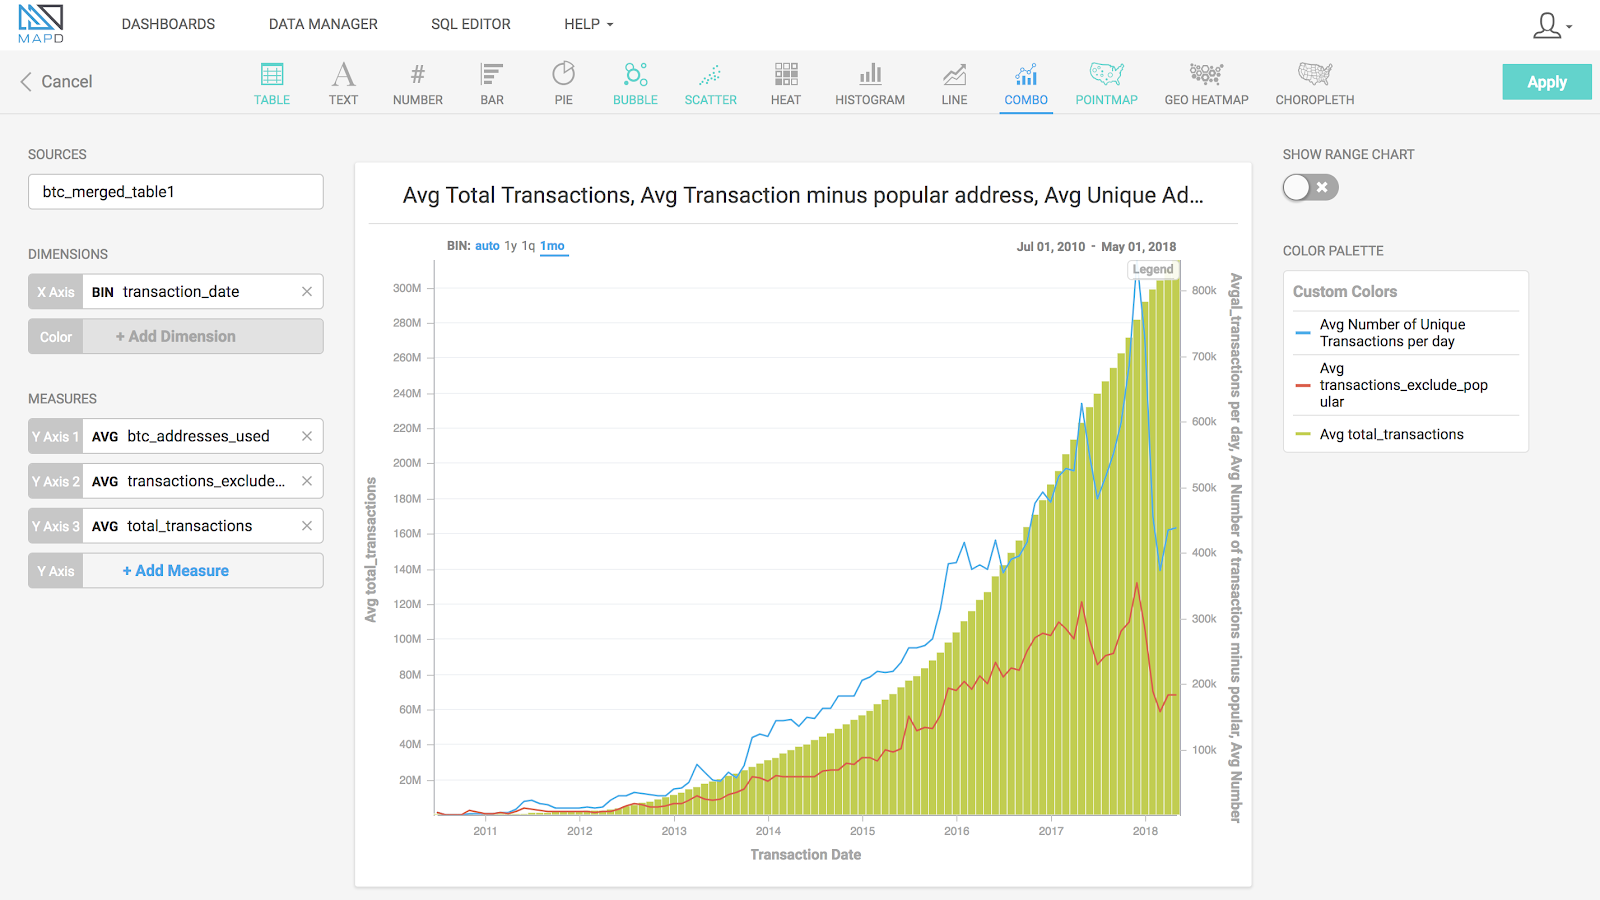
I found the Combo Chart feature of Immerse most insightful while creating the dashboard for the Bitcoin data. I used the transaction date for the dimension, which is represented on the X-Axis, and selected the following measures which are rendered on the Y-Axis:
- Average number of unique Bitcoin addresses used per day
- Average number of transactions per day excluding popular addresses
- Average total number of unique transactions per day
As the total number of transactions ranges in the 100s of million per day, I moved the other measures to a secondary Y-Axis. Also, the total number of transactions is represented as a vertical bar chart while the other measures use a line chart for clarity.
Combo Chart - Bitcoin Transactions
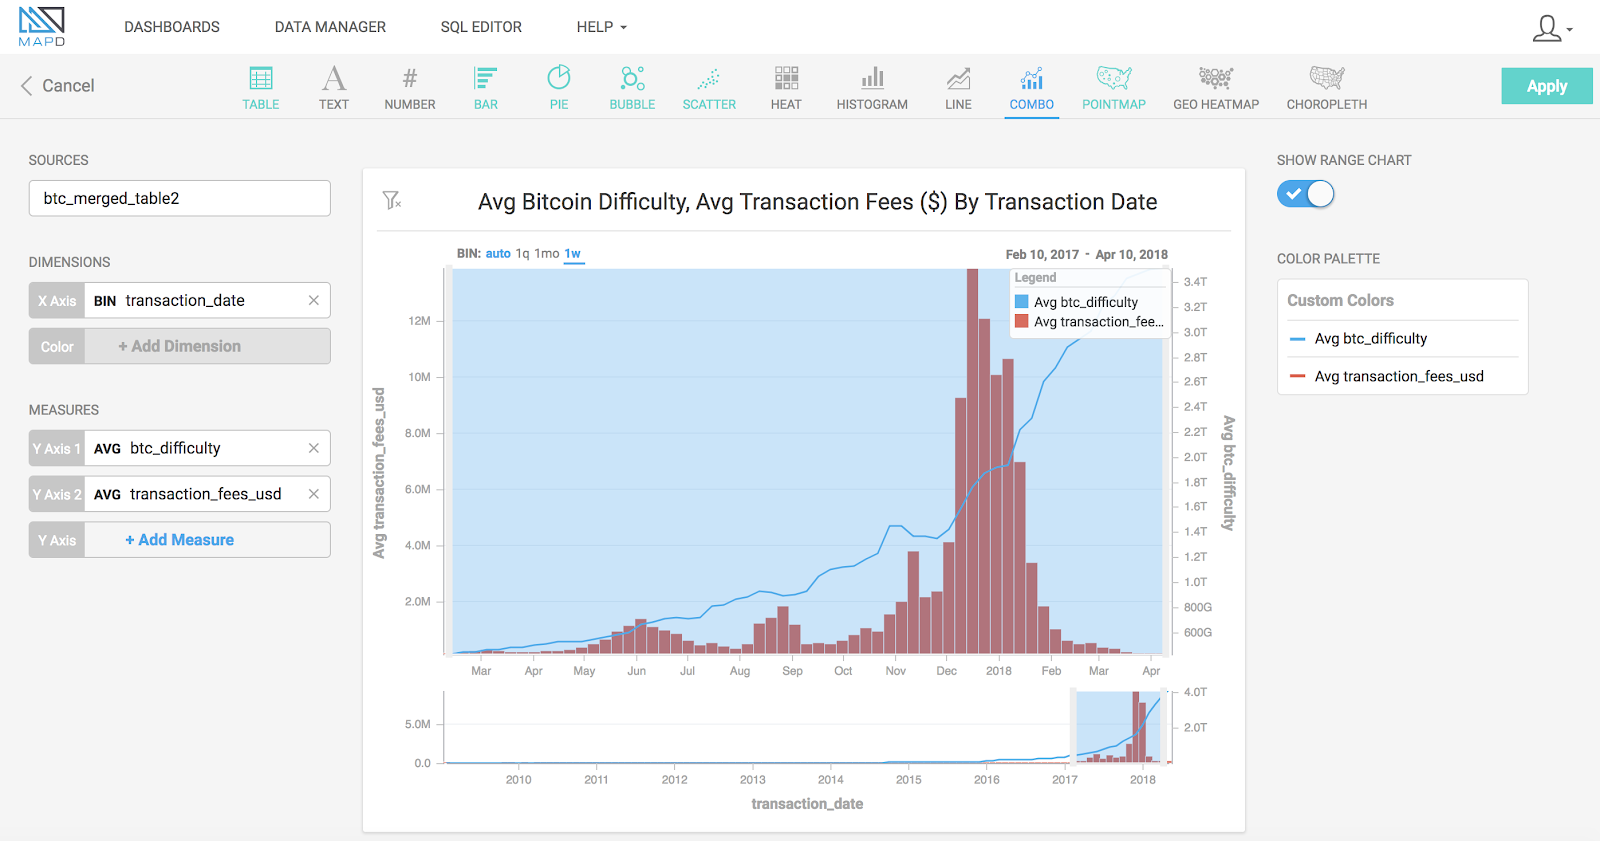
I use combo charts to show a correlation between related metrics in a Bitcoin transaction. One chart plots the price of Bitcoin in US dollars versus the Bitcoin transaction volume in US dollars. I use another chart to show the total transactions occurring daily alongside the number of transactions per day that don't include the popular 100 Bitcoin addresses. A third chart shows the Bitcoin mining (computational) difficulty in finding a new block for transactions, alongside the amount earned by the miners as part of the transaction fees. While the difficulty to mine each blockchain block keeps increasing, the miners' transaction fees are related to the demand of Bitcoin, i.e., its rise in price as seen on the first chart towards the end of 2017 when there was a bidding war over the block space.
Combo Chart - Bitcoin Difficulty and Miners Transaction Fees
I use bar charts to show the number of input or output Bitcoin address that is classified as ordinary or popular, i.e., belonging to the top 100 Bitcoin addresses. To see the input addresses with most records and transaction IDs with most records, created a bar chart for each. The bars are colored based on the sum of the output Bitcoin that was transacted. I can click around on some of the chart elements or brush across a time range, and watch the other charts on the screen update instantaneously. This feature of MapD Immerse is called crossfilter, which allows a filter applied to one chart to simultaneously be applied to the rest of the charts on a dashboard. Crossfilter is possible even with massive data sets, because MapD is not pre-indexing or aggregating any of the data. Let me click on the popular input Bitcoin addresses and see how the million dollar transactions have played out during the wild ride of 2017.
Crossfilter in action!
What's Next
To tell the Bitcoin story in a visual and easy to understand format, we worked with a team of bright students from Berkeley Innovation, who came up with a prototype for visualizing the Bitcoin blockchain. Based on this prototype, we are working on a MapD application that will extend the above methodology to stream the Bitcoin transactions continuously from BigQuery into MapD database tables. The MapD Bitcoin application will be accessible from any browser to visually analyze the Bitcoin data and gain insights into world's hottest financial instrument. Join t tuned.


